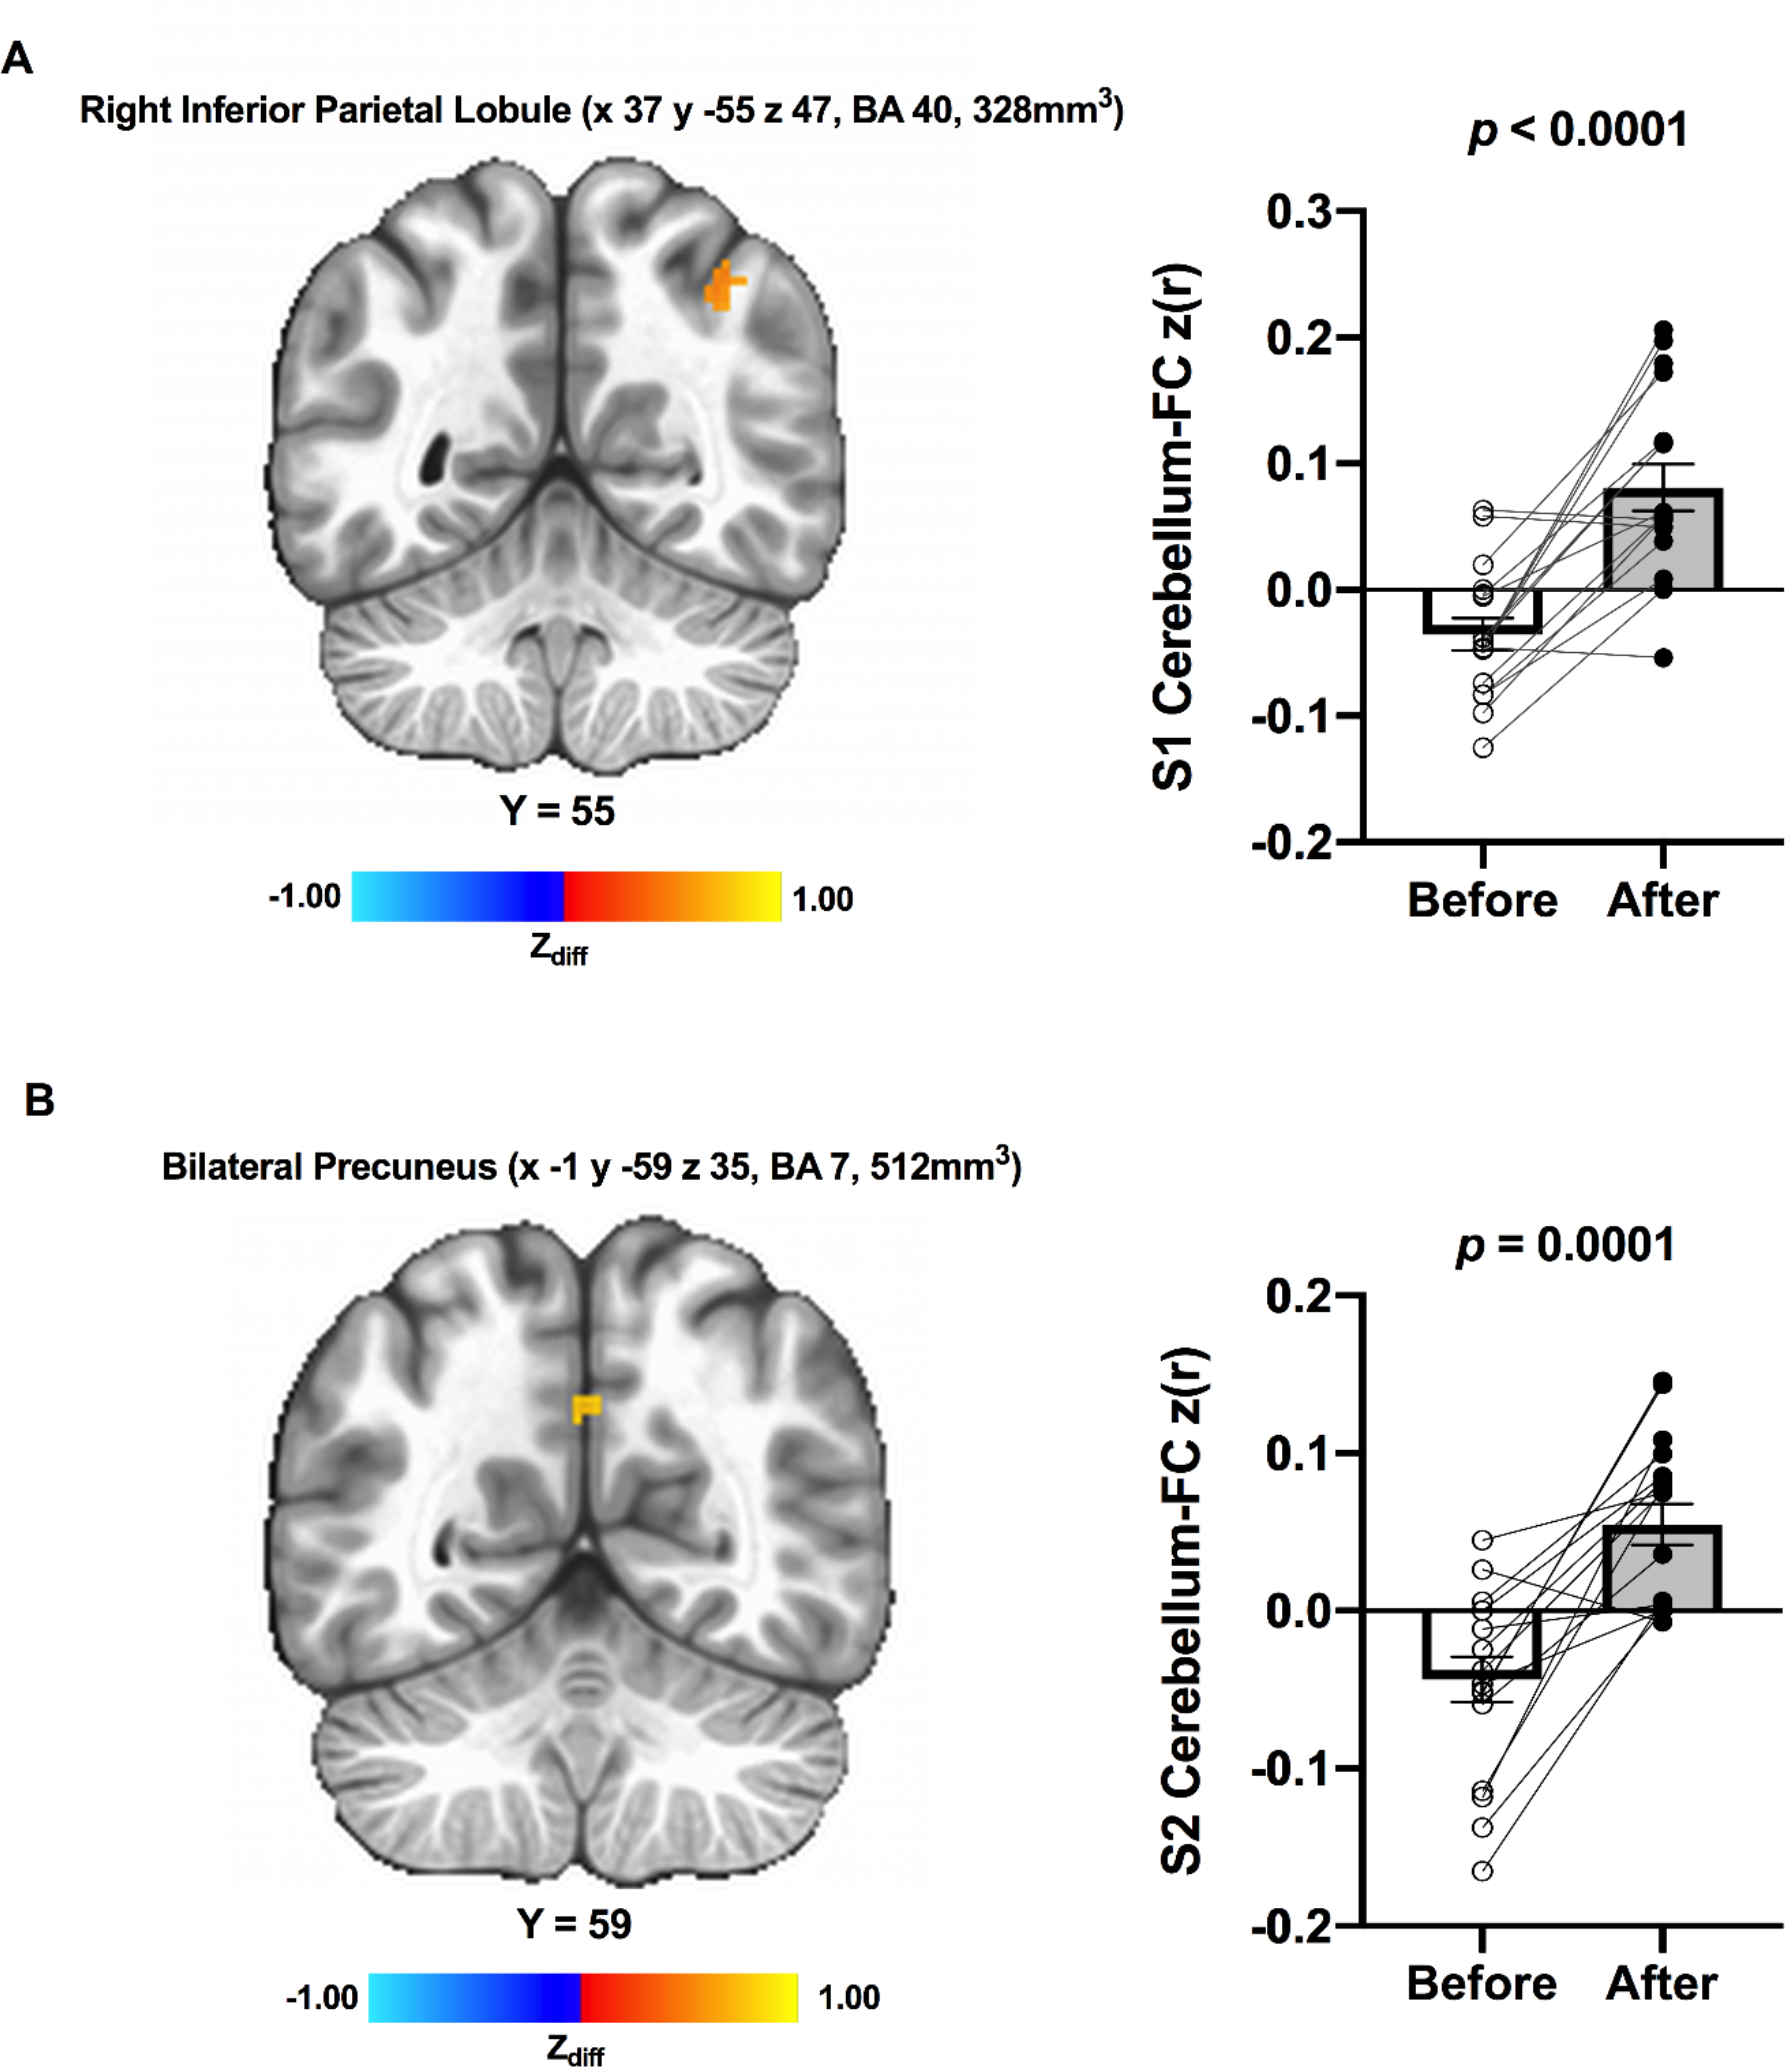
Fig 2.

Resting-state functional cerebellum connectivity was increased from before to after ET among individuals with HC; (A) Increased connectivity between the cerebellum seed 1 (MNI 37.9 −63.7 −29.7) and region within the right inferior parietal lobule (t(16) = 5.612, p < 0.0001, Cohen’s d = 1.361); (B) Increased connectivity between the cerebellum seed 2 (MNI 12.5 −86.1 −32.9) and region within bilateral precuneus (t(16) = 5.059, p = 0.0001, Cohen’s d = 1.226). Adjacent bar graphs indicate the connectivity between cerebellar seeds and each region (±SEM) for before and after ET, respectively. p-values above bar graphs indicate statistical difference from before to after ET. Notes: S1, seed 1; S2, seed 2.
