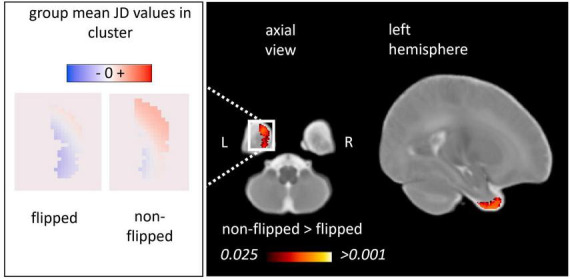
FIGURE 5.

Inter-hemispheric asymmetry of the regional fetal to neonatal morphometry change maps (framework A). We illustrated the anatomical clusters in which flipped and non-flipped morphometry change maps were significantly different, referring to an inter-hemispheric difference in the regional fetal to neonatal morphometry change (TFCE-corrected p < 0.025). Left panel: population mean, voxel-level JD values in the left and right hemispheres characterizing regional brain growth (flipped to illustrate anatomical match). Right panel: anatomical clusters overlaid on a neonatal T2-weighted template.
