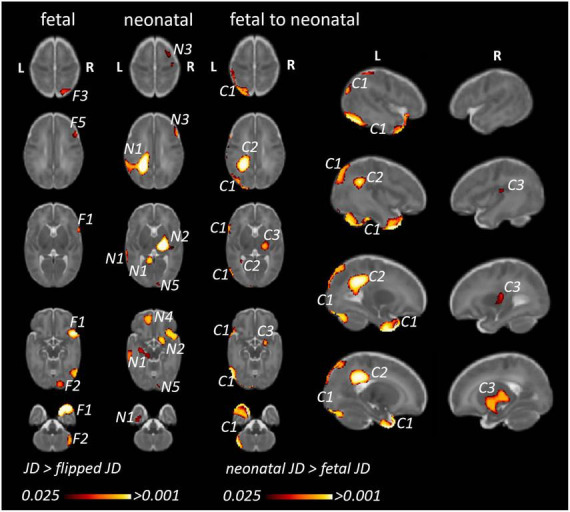
FIGURE 6.

Fetal and neonatal inter-hemispheric asymmetry and dynamic, age-related changes of inter-hemispheric asymmetry (framework B). (Fetal/neonatal) Clusters corresponding to anatomical regions showing (static) inter-hemispheric asymmetry in either the fetal or neonatal time points. (Fetal to neonatal) Clusters corresponding to anatomical regions where inter-hemispheric asymmetry showed differences between the neonatal and fetal timepoints. We only illustrate clusters where neonatal JD was higher than fetal JD, since the opposite statistical test (fetal JD > neonatal) would reveal very similar findings in the homotopic ipsilateral anatomical regions. F1…N: clusters representing regional asymmetry in the fetal images (significant TFCE-corrected clusters where flipped JD > non-flipped JD). N1…N: clusters representing regional asymmetry in the neonatal images (significant TFCE-corrected clusters where flipped JD > non-flipped JD). C1…N: clusters where inter-hemispheric asymmetry changed from fetal to neonatal age.
