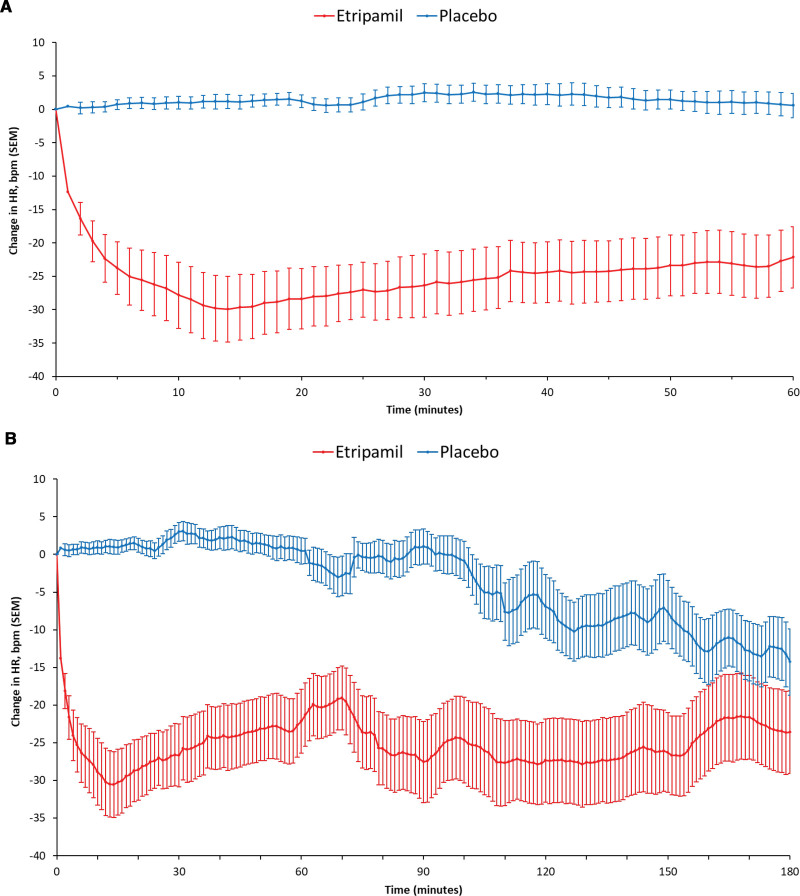
Figure 3.
Mean Change (± SEM) from Baseline in Ventricular Rate (bpm) over 60 minutes and 180 minutes. A, Mean change (±SEM) from baseline in ventricular rate (beats per minute [bpm]) over 60 minutes. B, Mean change (±SEM) from baseline in ventricular rate (bpm) over 180 minutes. Primary end point was mean maximum reduction in ventricular rate from adjusted baseline by ANCOVA; yielding P<0.0001 for difference in mean maximum reductions, placebo vs etripamil. Analysis performed separately from plot in A. *Separation of the placebo vs etripamil groups over the 180 minutes after drug administration was assessed based on a t test of difference between the areas under the curves (AUC0→180) of plots of absolute mean heart rate, yielding P<0.00001.

