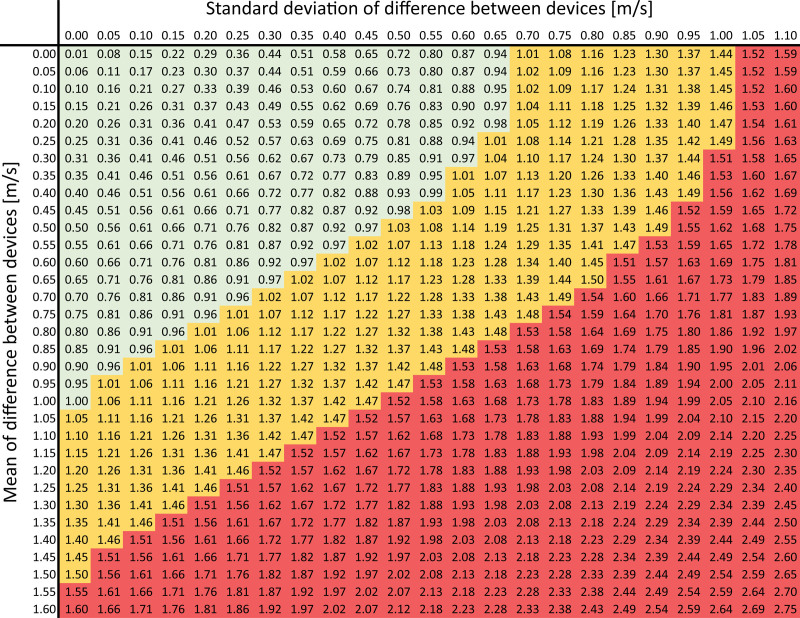
Figure.
Measurement error (m/s) for which the probability of observing such error or less is 85% (numbers on colored background). Colors (device validation outcome): green: good (error ≤1.0 m/s); orange: acceptable (error ≤1.5 m/s); and red: fail (error >1.5 m/s). Before looking up a combination of mean and SD, round up both values to 0.05-m/s precision (eg, 0.41 m/s is rounded to 0.45 m/s; 0.47 m/s is rounded to 0.50 m/s). For example, a mean difference of 0.36 m/s (rounded to 0.40 m/s) and an SD of that difference of 0.44 m/s (rounded to 0.45 m/s) correspond to an error of 0.88 m/s. This implies that, on average, 85% of the validation measurements are within ±0.88 m/s of the reference measurement. Because 0.88≤1.0 m/s, this device passes validation with good accuracy.

