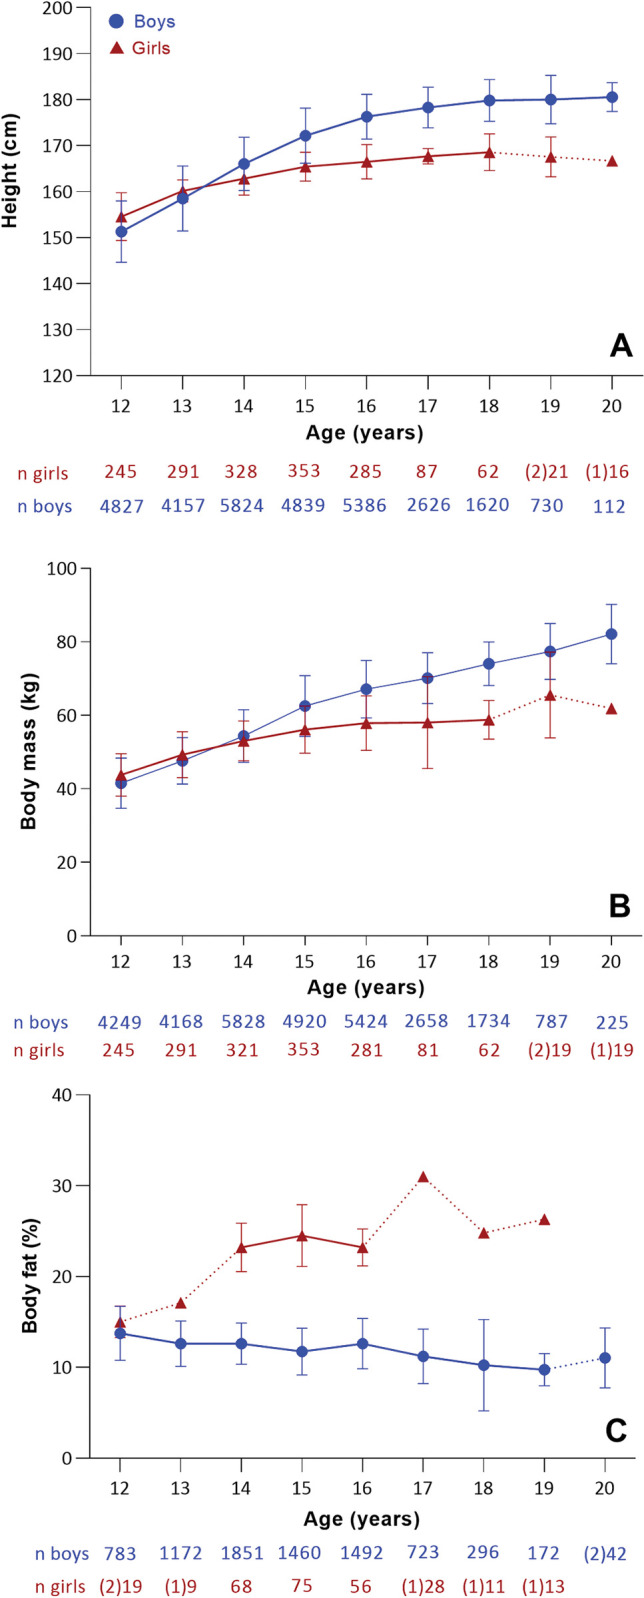
Fig 4.

Weighted data for height (A), body mass (B) and percentage body fat (C). The sample size for each age group is indicated below the x-axis. The numbers in parentheses represent the available studies for the respective age group. Dotted lines highlight age groups with two or fewer studies.
