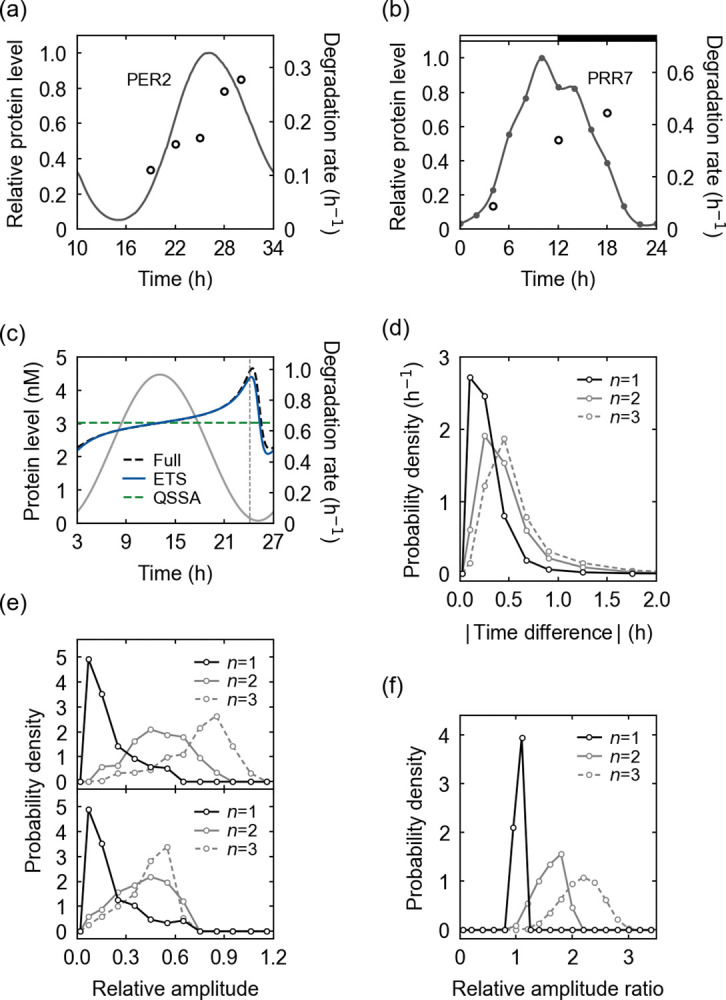
Fig 3. Rhythmic degradation of circadian proteins.

(a) The experimental abundance levels (solid line) and degradation rates (open circles) of the mouse PERIOD2 (PER2) protein [43]. (b) The experimental abundance levels (dots, interpolated by a solid line) and degradation rates (open circles) of PSEUDO RESPONSE REGULATOR 7 (PRR7) protein in Arabidopsis thaliana [44,45,48]. Horizontal white and black segments correspond to light and dark intervals, respectively. (c) A simulated protein degradation rate from the full kinetic model and its ETS- and QSSA-based estimates, when the degradation depends on a single PTM. In addition, the protein abundance profile is presented here (gray solid line). A vertical dashed line corresponds to the peak time of −A′(t)/A(t) where A(t) is a protein abundance. The parameters are provided in Table J in S1 Appendix. (d) The probability distribution of the peak-time difference between a degradation rate and −A′(t)/A(t) for each number of PTMs (n) required for the degradation. The probability distribution was obtained with randomly-sampled parameter sets in Table F in S1 Appendix. (e) The probability distribution of the relative amplitude of a simulated degradation rate (top) or its estimate in Eq (13) (bottom) for each n, when the relative amplitude of a protein abundance is 1. (f) The probability distribution of the ratio of the simulated to estimated relative amplitude of a degradation rate for each n. For more details of (a)–(f), refer to Text K in S1 Appendix.
