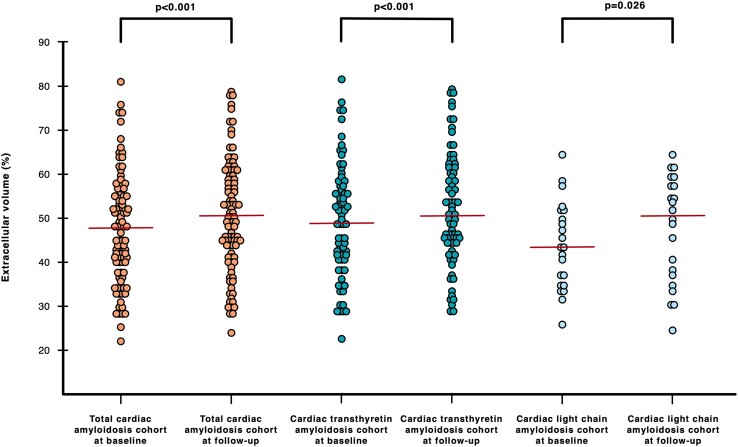
Figure 2.
Dot plots showing extracellular volume (ECV) at baseline and follow-up for the total (orange), transthyretin (turquoise), and light chain (light blue) cardiac amyloidosis cohorts. ECV at baseline and follow-up for the total cardiac amyloidosis cohort were 48.0% (IQR: 40.0–55.3) and 50.5% (IQR: 43.1–59.5 P < 0.001). ECV at baseline and follow-up for the cardiac transthyretin amyloidosis were 48.0% (IQR: 40.0–55.3) and follow-up 50.5% (IQR: 43.1–59.5, P < 0.001). ECV at baseline and follow-up for the cardiac light chain amyloidosis cohort were 42.6% (IQR: 34.4–51.0) and 50.6% (IQR: 35.7–57.4, P = 0.028). Red lines indicate median.

