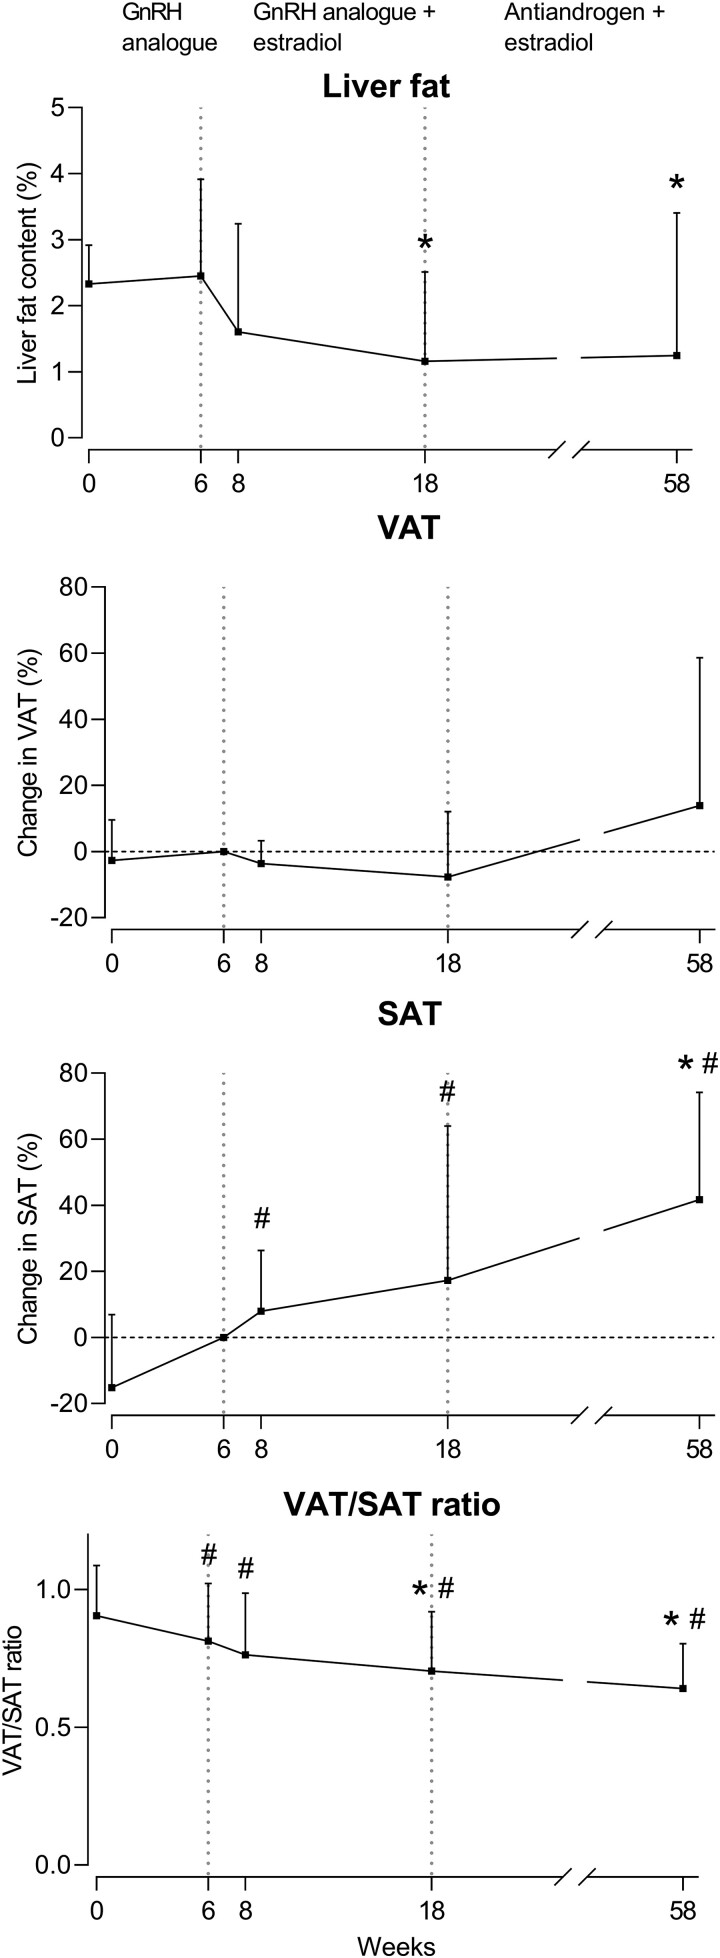
Figure 3.
Percentage change in liver fat content, VAT, SAT, and VAT/SAT ratio over time in trans women. Liver fat is presented as median with IQR. Change in VAT, SAT, and VAT/SAT ratio are presented as mean ± SD., # P < 0.05 compared to week 0, * P < 0.05 compared to week 6.
Abbreviations: IQR, interquartile range; SAT, subcutaneous adipose tissue; VAT, visceral adipose tissue.

