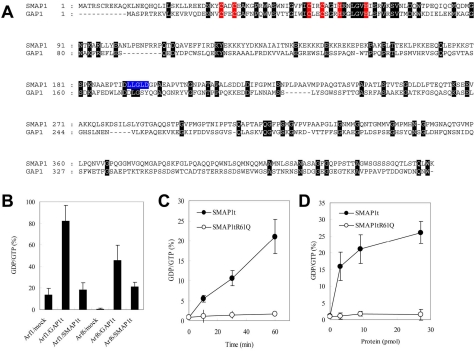
Figure 1.
SMAP1 is an ArfGAP. (A) Alignment of the amino acid sequences of SMAP1 (Sato et al., 1998) and GAP1 (Cukierman et al., 1995). The C2C2H2 zinc finger motif that is conserved among various ArfGAPs is indicated in red. The amino acid residues that are identical in SMAP1 and GAP1 are indicated by dark highlighting. A putative clathrin box in SMAP1 is indicated in blue. (B) Substrate specificity of ArfGAPs. One microgram of GTP-loaded Arf1 or Arf6 was incubated for 60 min with 9 pmol of GAP1t or SMAP1t in the indicated combinations. Mock means no addition of GAP1t or SMAP1t. GTP and GDP bound to Arfs were extracted and separated from each other by TLC. Phosphor-images of chromatograms were scanned by a densitometer, and the percentages of the GTP that had been hydrolyzed to GDP were calculated as the GDP/GTP ratios. The averages and SDs from two independent experiments are presented for each Arf and ArfGAP combination. (C) Time course of GTP-hydrolysis by SMAP1t. One microgram of GTP-loaded Arf6 and 9 pmol of SMAP1t or SMAP1t R61Q were incubated for the indicated time. The reaction mixture was processed as in B, and the percentages of GTP-hydrolysis were calculated. The averages and SDs from two independent experiments are presented for each point. Closed and open circles represent SMAP1t and SMAP1t R61Q, respectively. (D) Dependence of GTP-hydrolysis on the concentration of SMAP1t. One microgram of GTP-loaded Arf6 was incubated for 60 min with the indicated amount of SMAP1t or SMAP1t R61Q. The reaction mixture was proceeded as in B, and the percentages of GTP-hydrolysis were calculated. The averages and SDs from two independent experiments are presented for each point. Closed and open circles represent SMAP1t and SMAP1t R61Q, respectively.

