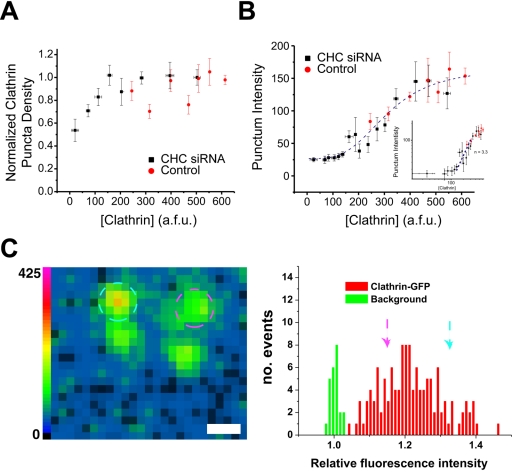
Figure 4.
Highly cooperative control of lattice intensity. (A) The total number of puncta within regions of cells transiently transfected with CHC siRNA or control conditions was counted. The number of puncta remained constant over the majority of the concentration range, decreasing only at very low clathrin concentrations in CHC siRNA cells. (B) The intensity of the fluorescence associated with each punctum selected in A was obtained for control and CHC siRNA-treated cells. These data were fit to Eq. 1 yielding the values n = 3.3, A = 313, and an offset of 26 U to show the nonlinear relationship between [clathrin] and the punctum intensity. The inset shows the same data on a log-log plot overlayed with a slope of n = 3.3. The graphed points in A and B represent the averaged values from several cells (n = 112 and 40 for CHC siRNA and control, respectively) ± SEM. (C) The left panel shows an image of clathrin spots taken from a cell whose clathrin was depleted significantly and resulted in very dim clathrin assemblies. The two circled assemblies (pink circle 46 afu, blue circle 24 afu) are each clearly visible above background (scale bar, 1 μm). The right panel shows the relative intensity distribution for all clathrin assemblies (in red) measured in cells whose [Clathrin] was severely depleted (ranging from [Clathrin] = 66 to [Clathrin] = 126 afu) compared with background areas (in green) in the same cells. The arrows indicate the position of the two circled clathrin assemblies shown in the left panel in this histogram.

