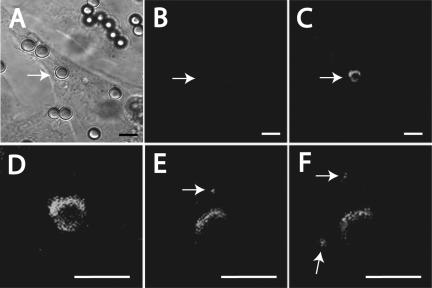
Figure 3.
Use of photoactivation to monitor FcγRIIA traffic in phagosomes. (A–F) CHO cells were transfected with FcγRIIA-PAGFP. Transfected cells expressing receptors were first identified by DIC based on their association with beads (A). The low fluorescence emitted by these cells before photoactivation was verified (B). The FcγRIIA-PAGFP associated with the phagosome indicated by the arrow was next activated using the Chameleon laser as described in Materials and Methods, and the appearance of fluorescence verified by confocal microscopy (C). (D–F) Magnified views of the same phagosome acquired shortly after activation (D) and 30 min (E) and 40 min (F) thereafter. Size bars, 5 μm.

