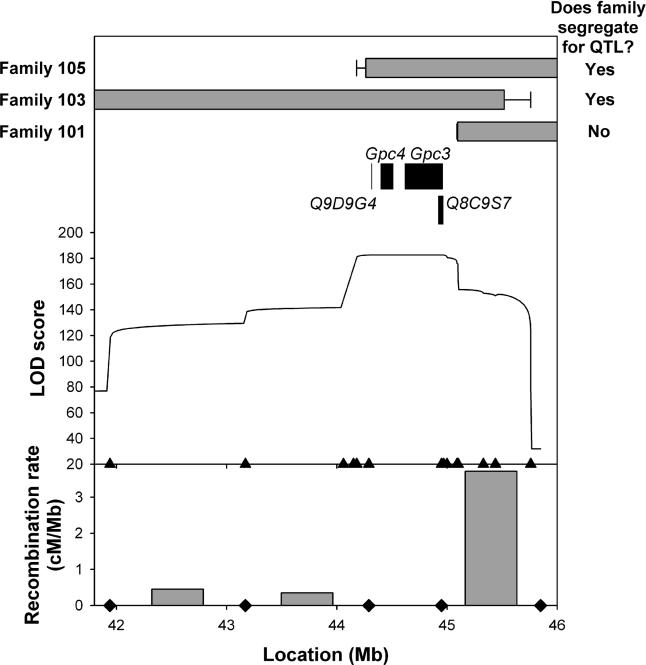
Figure 1. QTL Region.
At the top is shown the extent of Chr X segregating in three recombinant families. The horizontal grey bars indicate the regions known to segregate, while the error bars show the uncertainty in the location of recombination. Black bars indicate genes within the QTL region according to the Ensembl database [20]. Below is a LOD score plot for body mass at 6 wk in entire progeny test population (n = 1,909). Triangles indicate the locations of markers. At the bottom, recombination rates are shown for the intervals delimited by diamonds (the Chr X average is 0.40 cM/Mb [40]).

