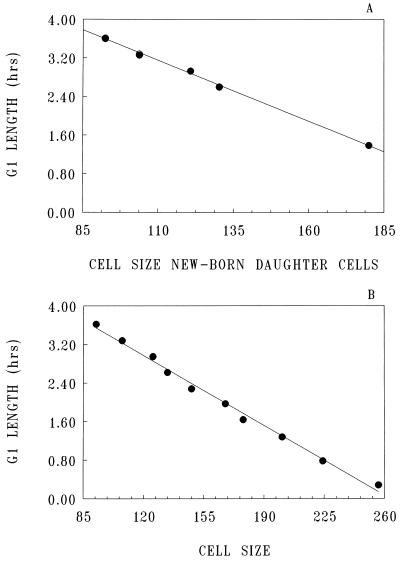
FIG. 4.
Cell size of newborn daughter cells produced during the shift-up relative to their G1 durations. (A) The cell sizes of the newborn daughter cells were determined as described in Fig. 2; their G1 durations were determined as described in Table 1. (B) Cell sizes during cell cycle progression for the cohort of daughter cells originated at t = 0.666 (Fig. 3) relative to the remaining G1 phase duration. Data are expressed as the average channel number of the relative protein content distributions (TRITC signals).

