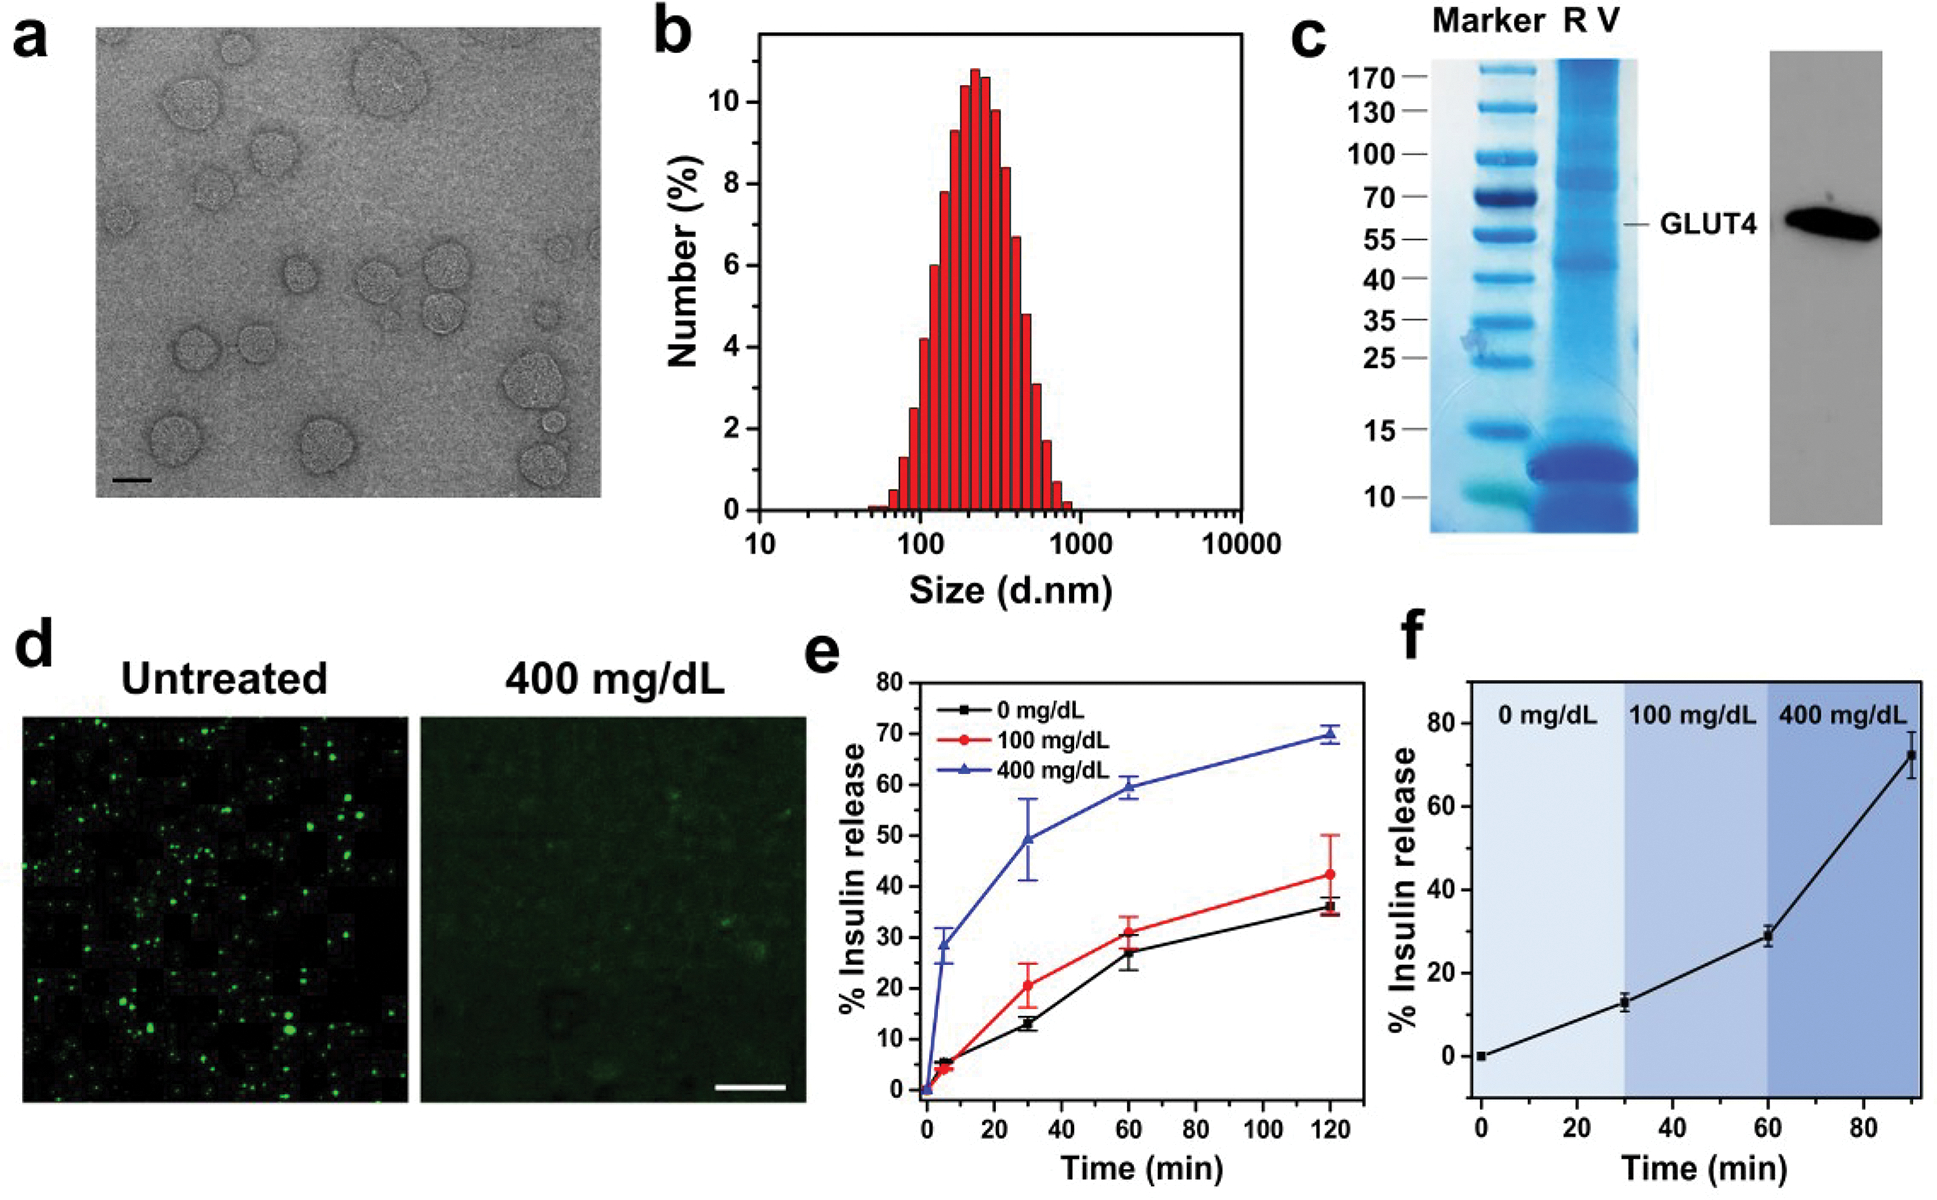
Figure 2.

Characterization of the Glu-Insulin attached RBC vesicles. (a) TEM image showing the size and morphology of RBC vesicles (scale bar: 200 nm). (b) Size-distribution histogram of RBC vesicles measured by DLS. (c) SDS–PAGE and Western blot analysis of the obtained RBC vesicles, indicating the existence of GLUT4 on RBC vesicles. (d) Confocal microscopy images of the Glu-Insulin attached RBC vesicles untreated or treated with 400 mg/dL glucose solution (scale bar: 10 μm). (e) In vitro accumulated Glu-Insulin release from the RBC vesicles in solutions with different glucose concentrations. (f) Self-regulated insulin release profile of the RBC vesicles as a function of glucose concentration. The error bars represent the standard error of the mean (s.e.m.) (n = 4). Green color indicated FITC-labeled insulin.
