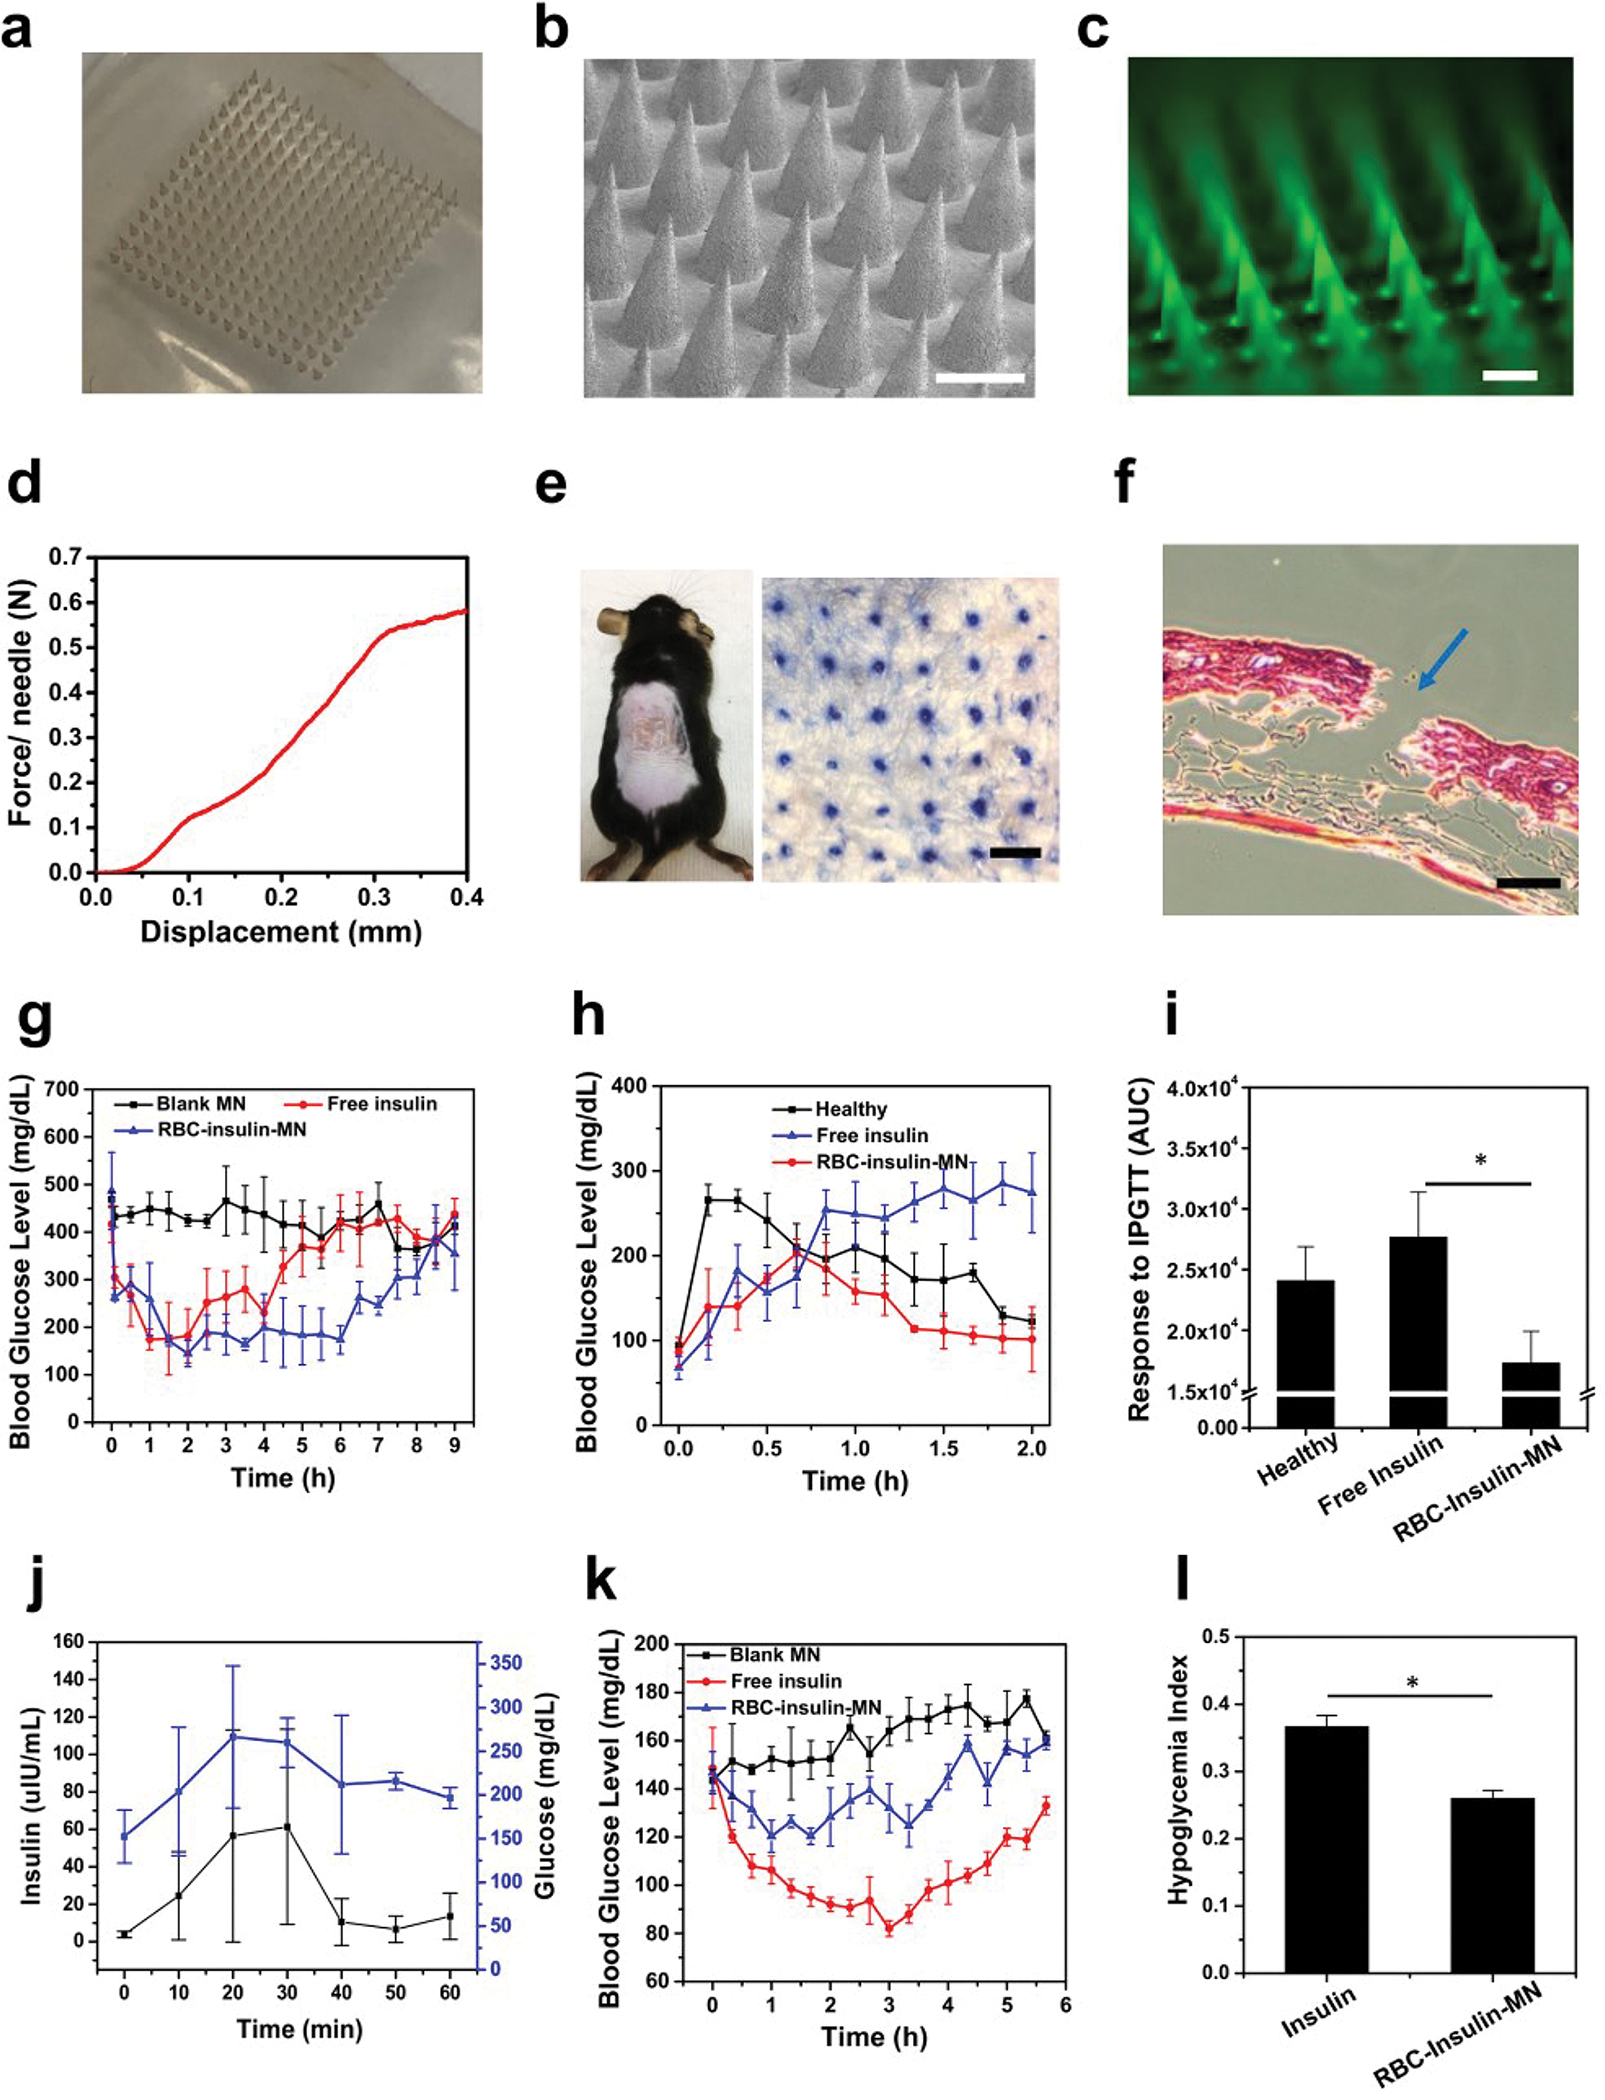
Figure 3.

In vivo evaluation of RBC vesicle-loaded MN array patches for the treatment of type 1 diabetes. (a) Photos of the MN array. (b) SEM image of the MN array (scale bar is 400 μm). (c) Fluorescence microscopy image of MNs containing FITC-labeled insulin-attached RBC vesicles (scale bar is 400 μm). (d) Mechanical property of the MN. The failure force for the desired MN was quantitatively measured to be 0.6 N/needle. (e) Mouse dorsum skin was transcutaneously treated with one MN patch, and the image of trypan blue-stained mouse skin showing the penetration of the MN patch into the skin (scale bar is 500 μm). (f) H&E-stained section of a cross-sectional mouse skin area penetrated by one MN (blue arrow indicates the area penetrated by one MN; scale bar: 500 μm). (g) BG levels in STZ-induced diabetic mice after different treatments. (h) In vivo glucose tolerance test in STZ-induced diabetic mice at 1 h post treatment of MN or subcutaneously injected with insulin. Nondiabetic mice were also used as the control. (i) Responsiveness was calculated based on the area under the curve in 120 min. (j) Change in plasma insulin levels and glucose levels after IPGTT. (k) BG levels of healthy mice treated with MN or subcutaneously injected with insulin over time. (l) Quantification of the hypoglycemia index, calculated from the difference between the initial and nadir BG readings divided by the time at which nadir was reached. The error bars represent the standard error of the mean (s.e.m.) (n = 5). P value: *P < 0.05.
