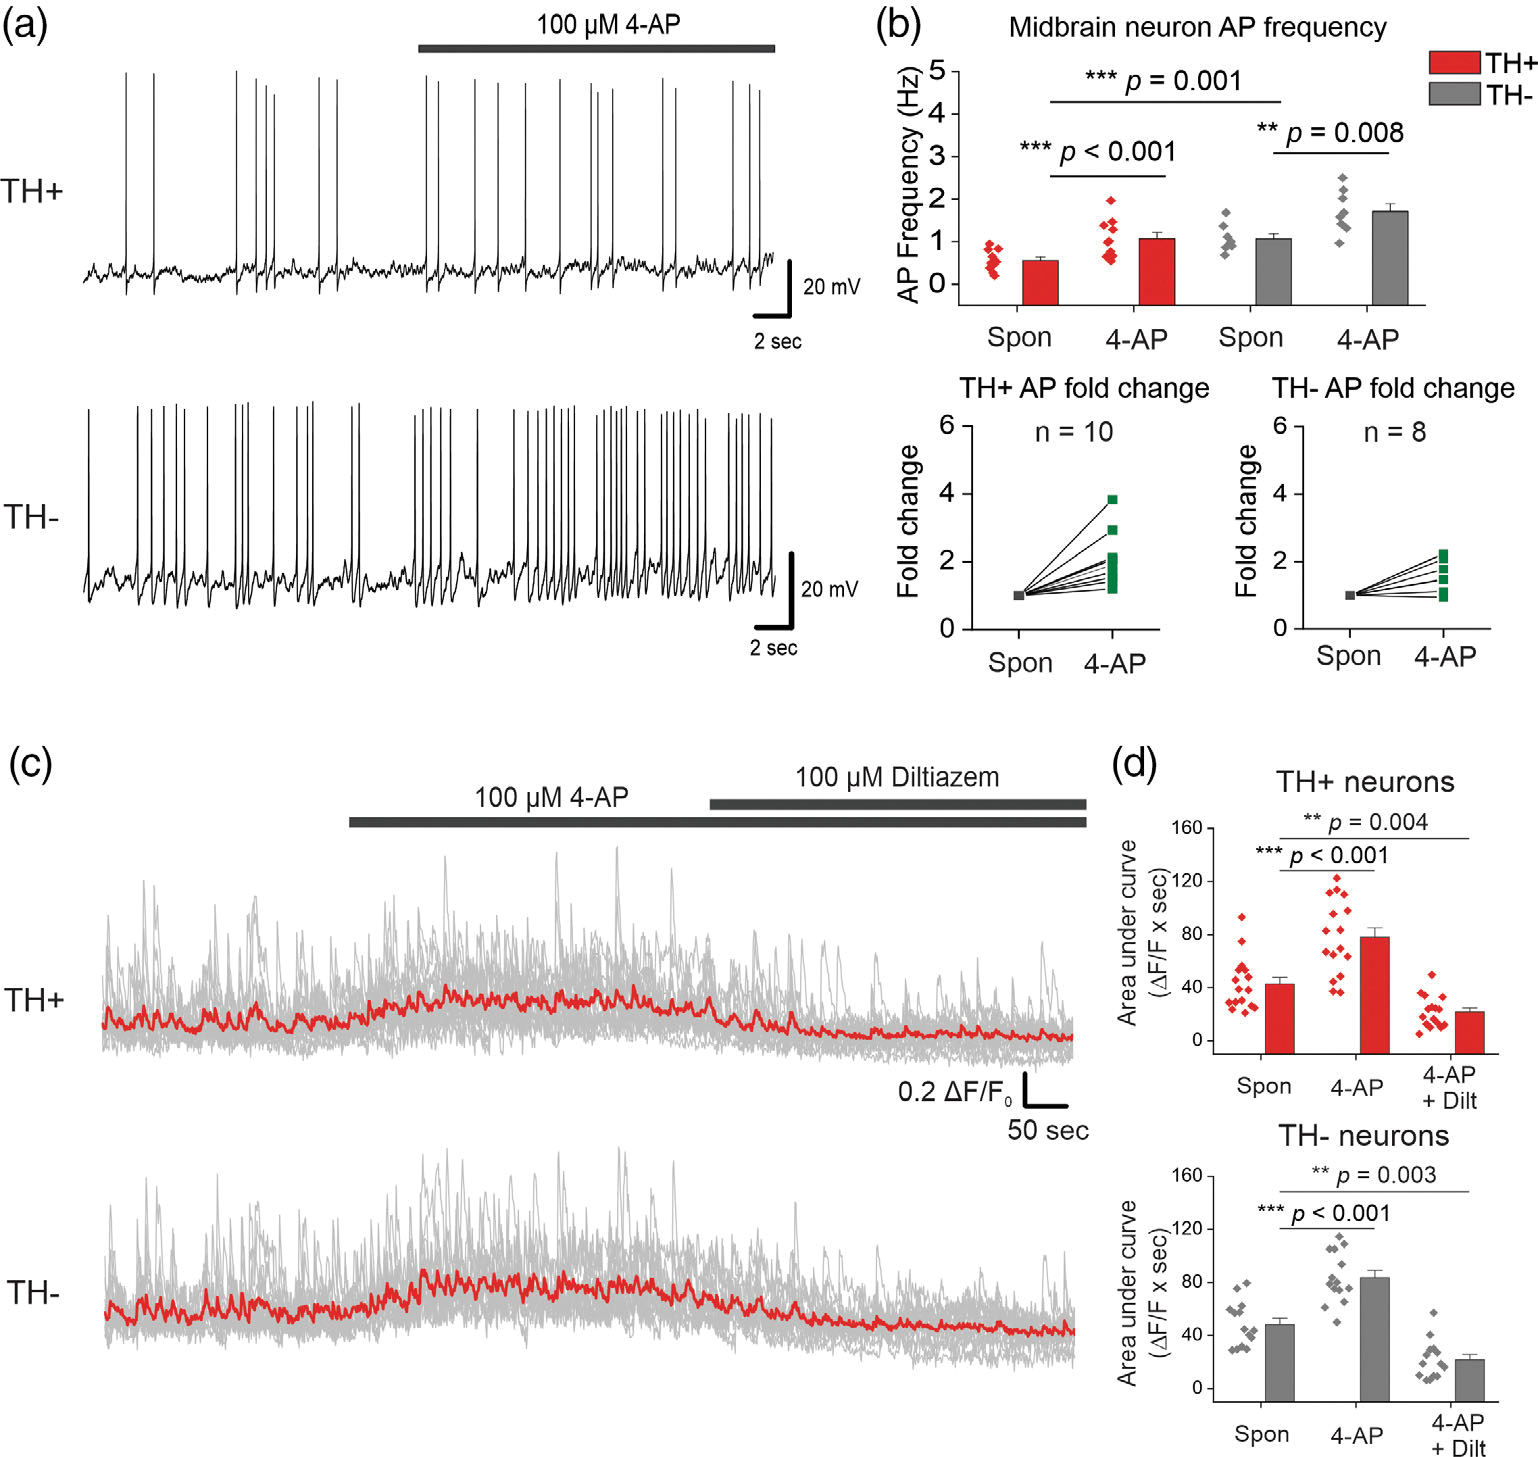
FIGURE 8.

The A-type VGKC inhibitor, 4-AP mimics S100B-mediated increases in intrinsic APs and L-type VGCC-mediated Ca2+ flux frequencies in midbrain neurons. (a) Representative traces of AP recordings from TH+ and TH− neurons with acute application of 100 μM 4-AP. (b) Average AP frequency of TH+ and TH neurons with and without 4-AP; fold change for each TH+ and TH− neuron is shown in the graphs below. n = 10 for TH+ neurons and 9 for TH− neurons from two independent weeks of culture. All errors are SEM; p-values are based on paired sample t tests for TH+ spontaneous, TH+ 4-AP and TH− spontaneous, TH− 4-AP or two sample t tests for TH+ spontaneous, TH− spontaneous. (c) Representative Ca2+ traces of TH+ and TH− neurons with bath application of 4-AP, followed by co-application of 4-AP + diltiazem, the red line represents the average Ca2+ activity from all neurons of that cell type. (d) Graphs of average area under the curve with bath application of 4-AP, followed by co-application of 4-AP + diltiazem. n = 16 for TH+ neurons and 14 for TH− neurons from two independent weeks of culture. All errors are SEM; p-values for TH+ neurons are based on Wilcoxon signed-rank tests, and paired sample t tests for TH− neurons
