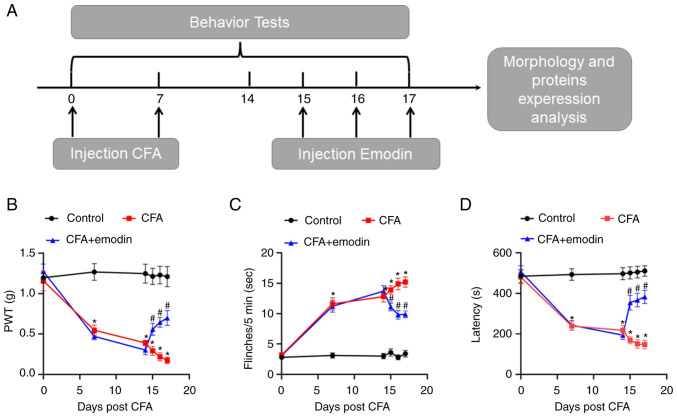
Figure 1.
Effect of emodin on pain behaviors. (A) Schematic diagram of the experimental process. Changes of (B) PWT values, (C) numbers of spontaneous flinches and (D) latency to fall in different groups. Data are presented as the mean ± SEM (n=10). *P<0.05 vs. control group; #P<0.05 vs. CFA group. PWT, paw withdrawal threshold; CFA, complete Freund's adjuvant.

