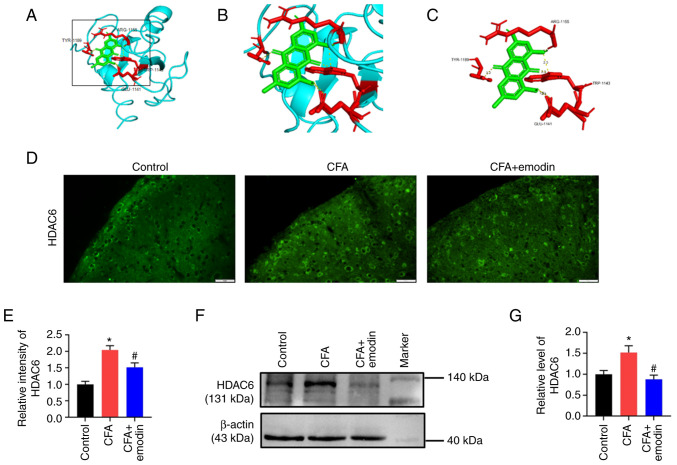
Figure 4.
Effect of emodin treatment on HDAC6 activity. (A) The modeled 3D structure of HDAC6 docked with emodin. (B) An enlarged view of the binding site is displayed in the inset box. (C) The interaction bonds of HDAC6 with emodin. The HDAC6 protein is shown in cyan, emodin is colored green, the interacting residues as red, bonds are shown as yellow dotted lines and bond lengths are depicted as numbers. (D) Representative immunofluorescence staining images and (E) quantitative intensity analysis of HDAC6 of each group. Scale bar, 20 µm. Representative (F) western blots and (G) quantitation of HDAC6 expression levels. Data are presented as the mean ± SD (n=5). *P<0.05 vs. control group, #P<0.05 vs. CFA group. HDAC6, histone deacetylase 6; CFA, complete Freund's adjuvant.

