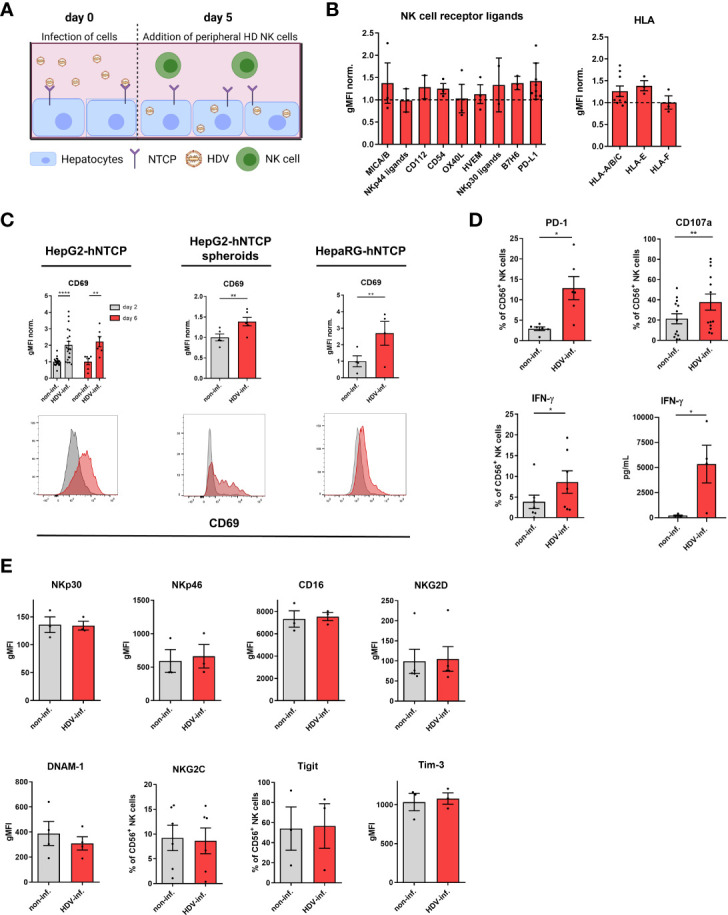
Figure 1.

HDV-infected hepatocytes trigger NK cell activation. (A) Schematic overview of the established in vitro co-culture system of NK cells and HDV-infected hepatocytes (created with BioRender.com). (B) Surface expression of the NK cell receptor ligands MICA/B (n=3), NKp30 ligand (n=2), NKp44 ligand (n=2), CD54 (n=3), CD112 (n=2), OX40L (n=3), HVEM (n=3), B7H6 (n=3), PD-L1 (n=8) and of the HLA-A/B/C (n=9), HLA-E and HLA-F (n=3) molecules by HDV-infected HepG2-hNTCP cells 5 days after infection with HDV (bars represent the geometric mean of the fluorescence intensity normalized to the mean of non-infected controls +/- SEM). (C) Surface expression of CD69 on NK cells after co-culture with non-infected or HDV-infected HepG2-hNTCP cells for 2 or 6 days [n=6 (day6), n=20 (day2)], HepG2-hNTCP spheroids for 2 days (n=5) or HepaRG-hNTCP cells for 2 days (n=4) (bars represent the geometric mean fluorescence intensity of positive cells normalized to the mean of non-infected controls +/- SEM). Representative stainings are shown as histograms (grey: non-infected; red: HDV-infected). (D) Surface expression of PD-1 (n=6), CD107a (n=13), intracellular expression of IFN-γ (n=7) by NK cells and level of IFN-γ (n=4) in supernatants of co-cultures of NK cells with non-infected or HDV-infected HepG2-hNTCP cells after 2 days as determined by FACS analysis or Legendplex assay respectively (bars represent the mean frequency of positive cells or absolute amount of cytokines +/- SEM). (E) Surface expression of the activating receptors NKp30, NKp46, CD16, DNAM-1, and NKG2D (n=3) on NK cells among PBMCs or on isolated NK cells [NKG2C (n=6)] in co-culture with non-infected or HDV-infected HepG2-hNTCP cells after 2 days of co-culture and surface expression of the inhibitory receptors Tigit and Tim-3 on NK cells in co-culture with non-infected or HDV-infected HepG2-hNTCP cells after 2 days (n=3) (bars represent the mean geometric fluorescence intensity or frequency of positive cells +/- SEM). Levels of significance: *p<0.05, **p<0.01, ****p<0.0001 (student’s t-test).
