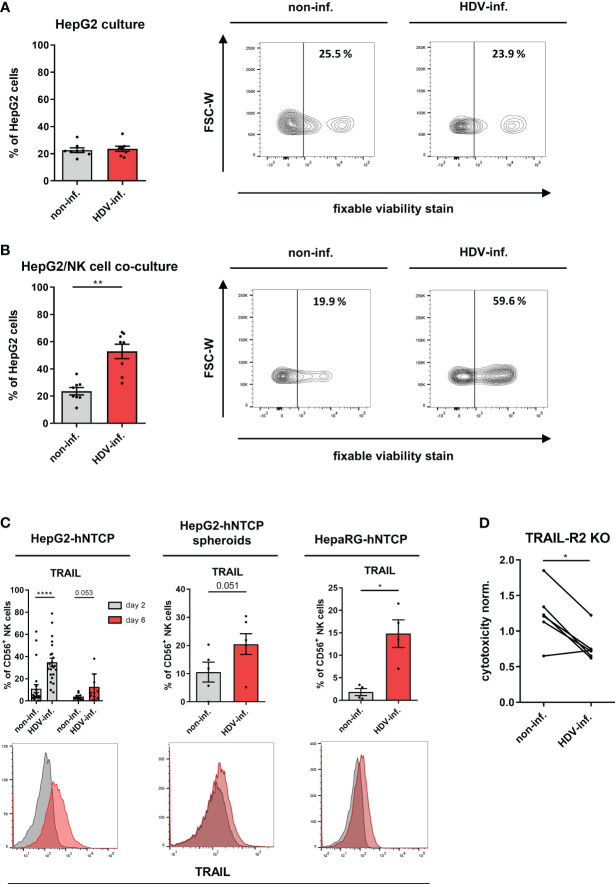
Figure 2.
Cytotoxicity of NK cells in HDV infection. (A) Frequency of dead cells (fixable viability dye+) among non-inf. or HDV-inf. HepG2-hNTCP cells 7 days after infection with representative contour plots (n=8) (bars represent the mean frequency of positive cells +/- SEM). (B) Frequency of dead cells (fixable viability dye+) among non-inf. or HDV-inf. HepG2-hNTCP cells after 2 days of co-culture with NK cells with representative contour plots (n=8) (bars represent the mean frequency of positive cells +/- SEM). (C) Surface expression of TRAIL on NK cells after co-culture with non-infected or HDV-infected HepG2-hNTCP cells for 2 or 6 days [n=9 (day2), n=23 (day6)], HepG2-hNTCP spheroids for 2 days (n=6) or HepaRG-hNTCP cells for 2 days (n=4) (bars represent the geometric mean fluorescence intensity of positive cells normalized to the mean of non-infected controls +/- SEM). Representative stainings are shown as histograms (grey: non-infected; red: HDV-infected). (D) Cytotoxicity of NK cells against non-infected or HDV-infected HepG2-hNTCP-TRAILR2 knock out cells (n=6) as determined by LDH assay. Data is normalized to non-infected or HDV-infected HepG2-hNTCP-Cas9 control cells. Levels of significance: *p<0.05, **p<0.01, ****p<0.0001 (student’s t-test).

