Figure 3.
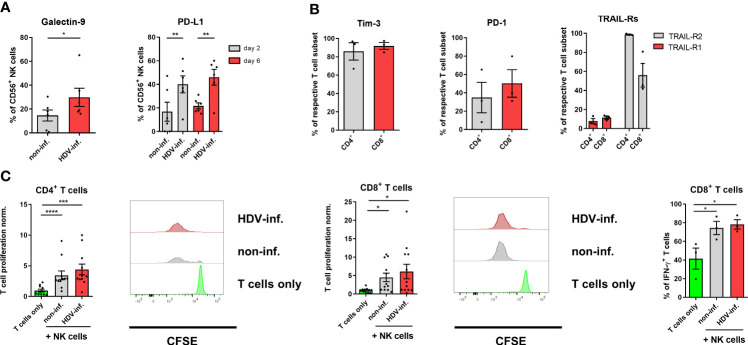
Influence of NK cells on T cells in HDV infection. (A) Surface expression of Galectin-9 and PD-L1 on NK cells after 2 days or 2 and 6 days of co-culture with non-infected or HDV-infected HepG2-hNTCP cells, respectively (n=6) (bars represent the mean frequency of positive cells +/- SEM). (B) Surface expression of Tim-3, PD-1 and TRAIL-R1/2 on CD3/CD28-stimulated CD4+ and CD8+ T cells (n=3) (bars represent the mean frequency of positive cells +/- SEM). (C) Proliferation of CD3/CD28 stimulated CD4+ and CD8+ T cells (n=11) and frequency of IFN-γ production (n=3) of CD8+ T cells alone, or in the presence of NK cells from co-cultures with non or HDV-infected HepG2-hNTCP cells after 96 h with representative histograms. NK cell/T cell ratio (1:4) (bars represent the mean frequency of positive cells normalized to the T cell only control +/- SEM or mean frequency of positive cells +/- SEM). Levels of significance: *p<0.05, **p<0.01, ***p<0.001, ****p<0.0001 (student’s t-test).

