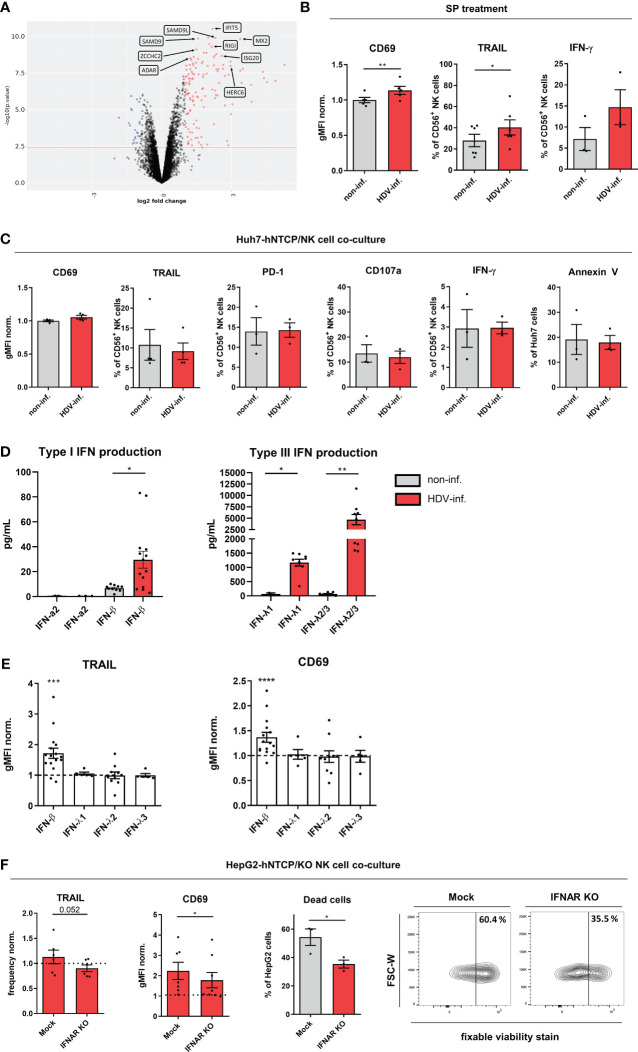
Figure 4.
IFN-β induces NK cell activity in HDV infection. (A) Volcano plot of differentially expressed genes (red: upregulated; blue: downregulated) by peripheral healthy donor NK cells in co-culture with non-infected or HDV-infected HepG2-hNTCP cells (n=5). (B) CD69, TRAIL surface (n=4) and intracellular IFN-γ (n=3) expression on NK cells treated with supernatants (SP) from non-infected or HDV-infected HepG2-hNTCP cells for 24h (bars represent the geometric mean fluorescence intensity of positive cells normalized to the mean of non-infected controls +/- SEM or mean frequency of positive cells +/- SEM). (C) Surface expression of CD69 and TRAIL (n=4), PD-1 and CD107a (n=3), intracellular expression of IFN-γ (n=3) by NK cells after 2 days of co-culture with non-infected or HDV-infected Huh7-hNTCP cells and frequency of apoptotic cells (Annexin V+) among non-infected or HDV-infected Huh7-hNTCP cells in co-culture with NK cells after 2 days (n=3) (bars represent the geometric mean fluorescence intensity of positive cells normalized to the mean of non-infected controls +/- SEM or mean frequency of positive cells +/- SEM). (D) Levels of IFN-α2 (n=2-3), IFN-β (n=10-14), IFN-λ1 (n=2-9) and IFN-λ2/3 (n=7-9) in cell culture supernatants of non-infected or HDV-infected HepG2-hNTCP cells 2 days after infection (bars represent the absolute amount of cytokines +/- SEM). (E) Surface expression of TRAIL or CD69 by CD56+ NK cells after treatment with either IFN-β (n=16); λ−1 (n=5)γ λ−2 (n=10)γ λ−3 (n=5) (2ng/mL) for 24h (n=19) (bars represent the geometric mean fluorescence intensity of positive cells normalized to the mean of untreated controls +/- SEM). (F) TRAIL (n=6) or CD69 (n=7-8) surface expression of CD56+ NK mock control and IFNαβR KO cells and frequency of dead (fixable viability+) HepG2-hNTCP cells after 48h of co-culture cells with representative contour plots (n=3) (bars represent the mean frequency of positive cells or the mean frequency or geometric mean fluorescence intensity of positive cells normalized to the mean of non-infected controls +/- SEM). *p<0.05, **p<0.01, ***p<0.001, ****p<0.0001 (student’s t-test).

