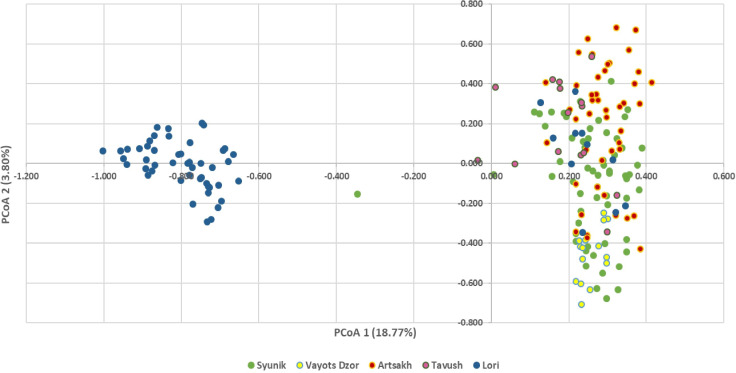
Figure 4.
Principal coordinate analysis (PCoA) represented by two axes using a covariance matrix of 24 nSSR locus of 196 accessions. Genepool A (right) and genepool B (left) are clearly differentiated. Wild genotypes of genepool A are labeled with the corresponding color for the group to which they belong.

