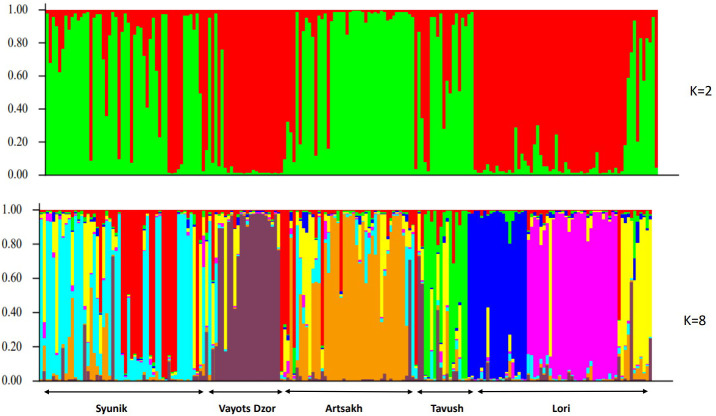
Figure 5.
Barplot displaying the admixture proportions of 196 wild genotypes as estimated by STRUCTURE analysis at K = 2 and K=8. Each accession is represented by a single vertical bar divided into K color segments representing its proportions in the two, and eight inferred genetic clusters using STRUCTURE software. Groups were named according to the geographic locations.

