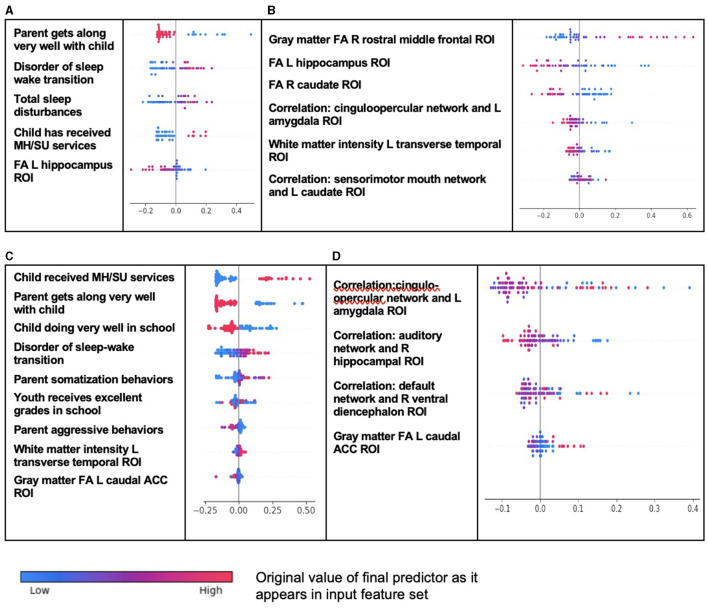
Figure 4.
Individual-level importance of final predictors of conduct disorder in early adolescence. Summary plots presented the importance of each final predictor (computed with the Shapley additive explanations technique) on an individual subject level to predicting CD with new onset at 11–12 years with (A) multimodal features and (B) only neural features and in all prevailing cases of CD at 11–12 years with (C) multimodal features and (D) only neural features. The color gradient represents the original value of each feature (metric) where red = high and blue = low. Discrete (binary) features appear as red or blue, while continuous features appear as a color gradient.

