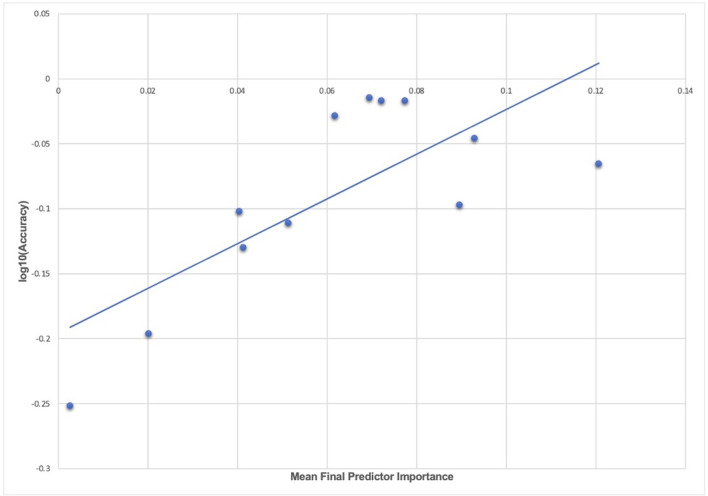
Figure 5.
The relationship between accuracy and final predictor importance. Average variable importance computed with the Shapley additive explanations technique is shown plotted against the log of prediction accuracy in testing in held-out data for each experiment in the study. The line of best fit obtained with a linear regression is also displayed. The underlying data for this chart may be inspected in Supplementary Table 4.

