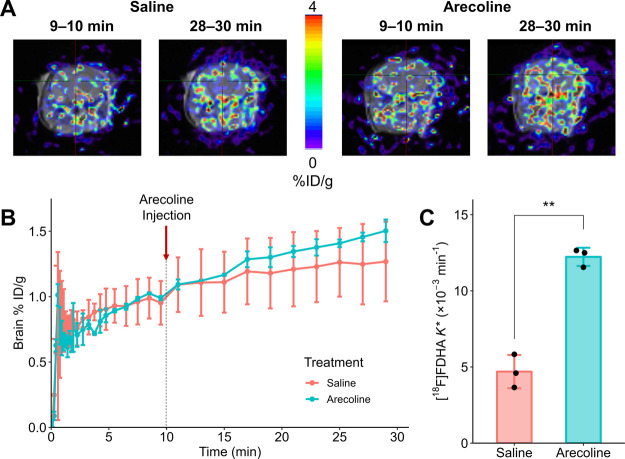
Figure 6.
(A) PET-MR images at the 9–10 and 28–30 min frames for representative mice treated with saline or arecoline. (B) %ID/g over time for mice treated with saline or 15 mg/kg arecoline (n = 3/group). The mean %ID/g values measured for mice treated with arecoline were not significantly higher than those of control mice. (C) Incorporation coefficients (K*) estimated by Irr2TCM using each mouse’s TAC as the output function. 22-[18F]FDHA K* estimates for mice treated with arecoline were significantly higher (**p < 0.01, Student’s t-test) than control mice.

