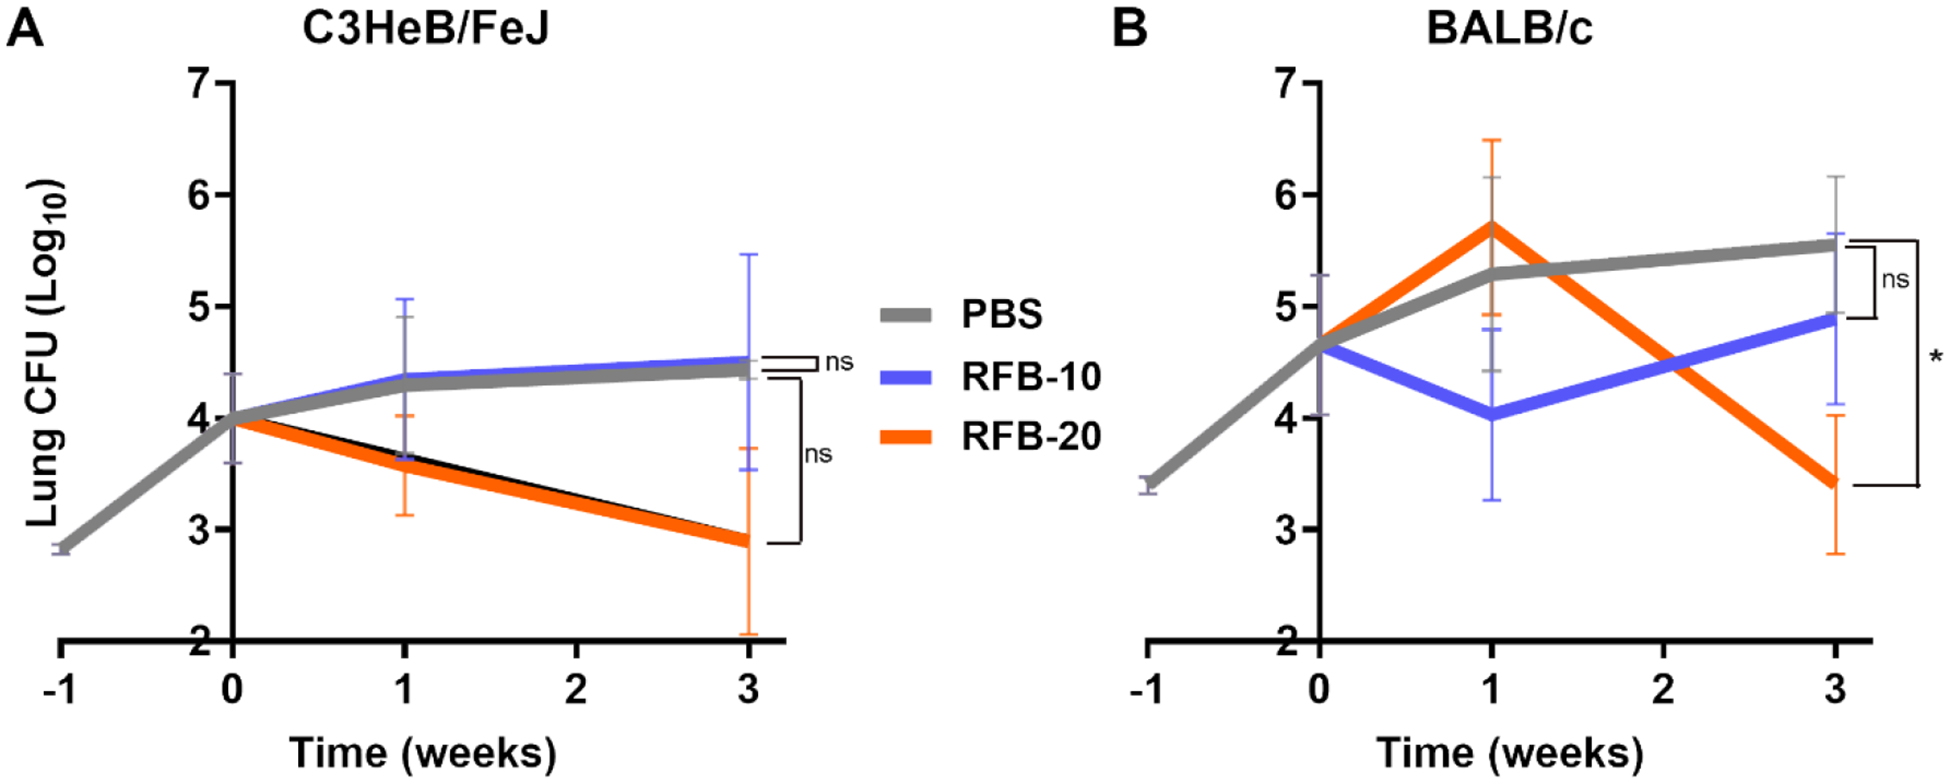
Figure 3. Burden of M. abscessus in the lungs of C3HeB/FeJ and BALB/c mice treated with rifabutin for three weeks.

Mean (±SEM) Mab lung burden (log10 CFU) in A) C3HeB/FeJ and B) BALB/c mice, n=5 per time-point, per treatment group, treated with 10mg/kg and 20 mg/kg rifabutin are shown in purple and orange, respectively. Mean (±SEM) Mab lung burden in the negative control group, administered with phosphate buffered saline (PBS), is shown in grey. Time-point week −1 represents the day following infection with Mab. Time-point week 0 represents the day antibiotic administration was initiated. RFB-10, 10mg/kg of rifabutin; RFB-20, 20mg/kg of rifabutin. P-values of PBS vs each treatment group are represented as stars: * represents p ≤0.05; ‘ns’ represents p>0.05 (not significant).
