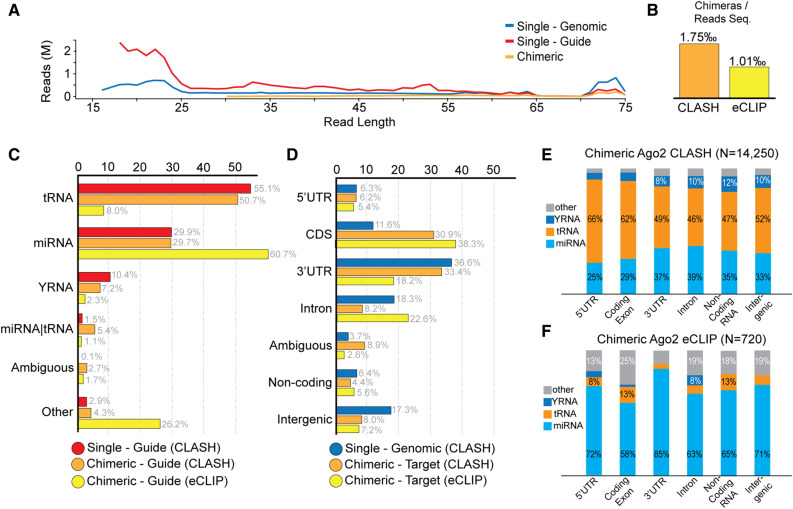
Figure 2.
(A) Read length distribution for sequencing reads annotated as genomic, guide, and chimeric. (B) Fraction of high confidence chimeric interactions per thousand reads for AGO2-CLASH and AGO2-eCLIP experiments. (C) Distribution of identified guide sequences on guide databases. (D) Distribution of genomic target sequences on genic element annotations. (E) Distribution of AGO2-CLASH chimeric reads on guide databases and genic annotation. (F) Distribution of AGO2-eCLIP chimeric reads on guide databases and genic annotations.

