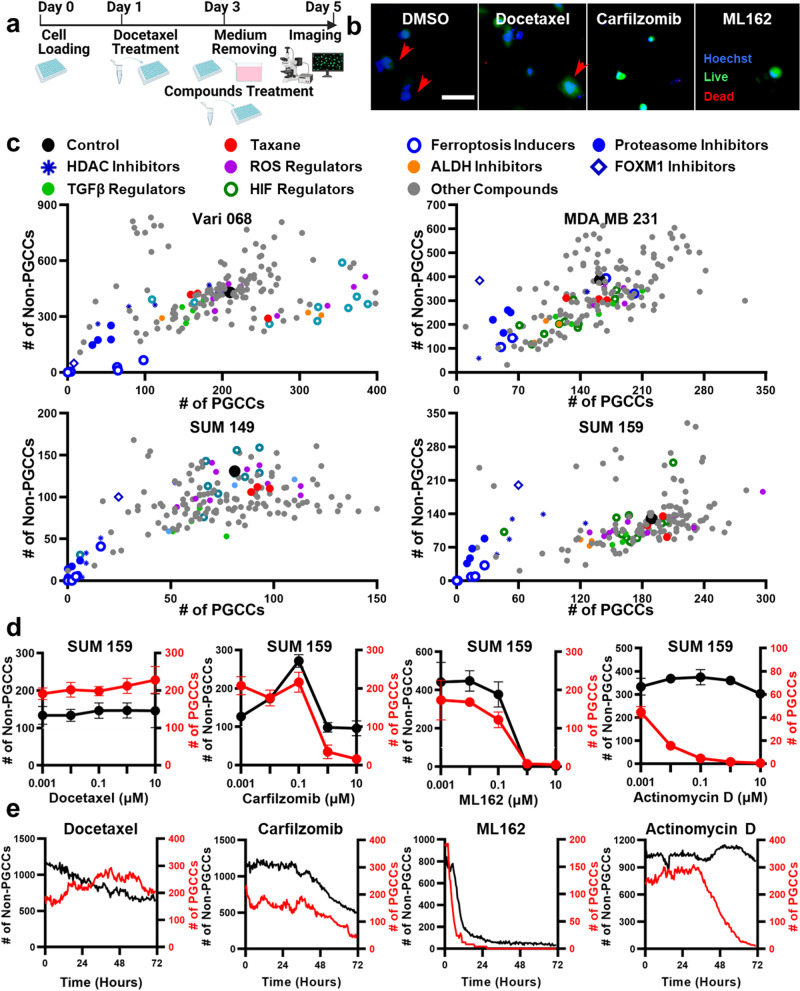
Fig. 3. Discover anti-PGCC compounds by screening experiments.
a Workflow to discover anti-PGCC compounds. Day 0: cell loading; Day 1: induction of PGCCs by 1 μM Docetaxel treatment; Day 3: removal of supernatant and screening of a library of 172 compounds; Day 5: staining and imaging cells for single-cell morphological analysis. The diagram was generated with elements from the Biorender. b Representative images of SUM159 treated with DMSO control, 1 μM Docetaxel, Carfilzomib, and ML162. Cells were stained with Live (green), Dead (red), and Hoechst (blue) staining reagents. PGCCs are marked with red arrows. (Scale bar: 100 μm). c Screening the effects of 172 compounds using Vari068, MDA-MB-231, SUM149, and SUM159 breast cancer cells. The x-axis represents the number of PGCCs after treatment, and the y-axis represents the number of non-PGCCs. Each dot represents the treatment of a compound. Different colors are used to indicate different classes of compounds. Statistical analysis is provided in Supplementary Data 4, 5. d Treatments of selected compounds (Docetaxel, ML162, Carfilzomib, and Actinomycin D) at 5 concentrations (10 μM, 1 μM, 0.1 μM, 0,01 μM, and 0.001 μM) on SUM159 cells. The x-axis represents the concentration of the selected compound. The left y-axis (black) represents the number of non-PGCCs, and the right y-axis (red) represents the number of PGCCs. The black curve indicates the number of non-PGCCs, and the red curve indicates the number of PGCCs. Error bars indicate the standard error of the mean (SEM), n = 3. e Dynamics of cell status. SUM159 cells pre-treated with Docetaxel for 2 days to induce PGCCs were treated with Docetaxel, ML162, Carfilzomib, and Actinomycin D and imaged every 30 min for 3 days. The x-axis represents time (hours), the left y-axis (black) represents the number of non-PGCCs, and the right y-axis (red) represents the number of PGCCs. The black curve indicates the number of non-PGCCs, and the red curve indicates the number of PGCCs. (n = 4).

