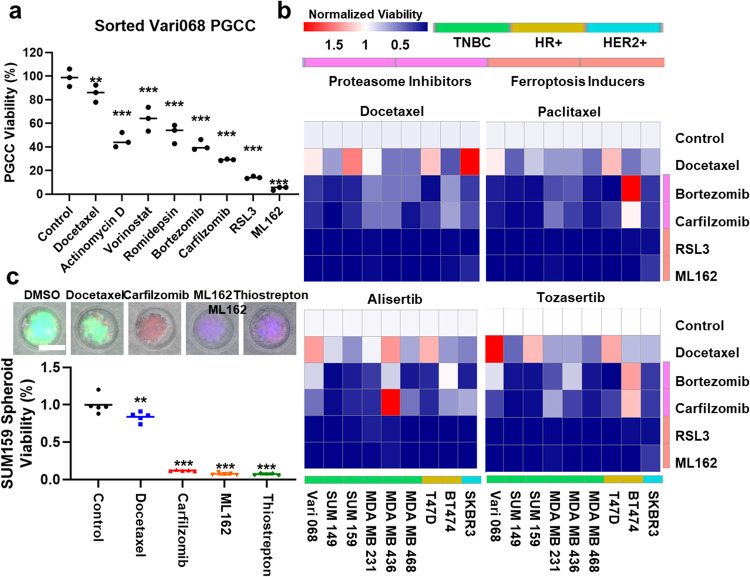
Fig. 4. Validation of anti-PGCC compounds using additional cell lines, untreated PGCCs, and different PGCC-inducing methods.
a Flow cytometry sorted untreated Vari068 PGCCs were treated by DMSO control, 1 μM Docetaxel, Actinomycin D, HDAC inhibitors (Vorinostat SAHA and Romidepsin), proteasome inhibitors (Bortezomib and Carfilzomib), and ferroptosis inducers (RSL3 and ML162). The y-axis represents the number of PGCCs after treatment of 2 days. Error bars indicate the standard error of the mean (SEM), n = 3. ** refers to P < 0.01, and *** refers to P < 0.001. b Inhibition of PGCCs induced by various methods: two chemotherapeutics (1 μM Docetaxel and Paclitaxel) and two Aurora inhibitors (1 μM Alisertib and Tozasertib). Nine breast cancer cell lines (HR-positive (T47D and BT474), HER2-positive (SKBR3), and TNBC (Vari068, SUM149, SUM159, MDA-MB-231, MDA-MB-436, and MDA-MB-468) were tested. Color gradient represents the cell viability normalized to the control. PGCCs generated by different methods and different cell lines were resistant to Docetaxel yet responded to proteasome inhibitors and ferroptosis inducers. Statistical analysis is provided in Supplementary Tables 2–5. c Drug testing on 3D cancer spheroid model. The consecutive treatments of Docetaxel and then PGCC-inhibiting compounds are significantly more effective than continuous treatment of Docetaxel and control. Error bars indicate the standard error of the mean (SEM), n = 5. ** refers to P < 0.01 and *** refers to P < 0.001.

