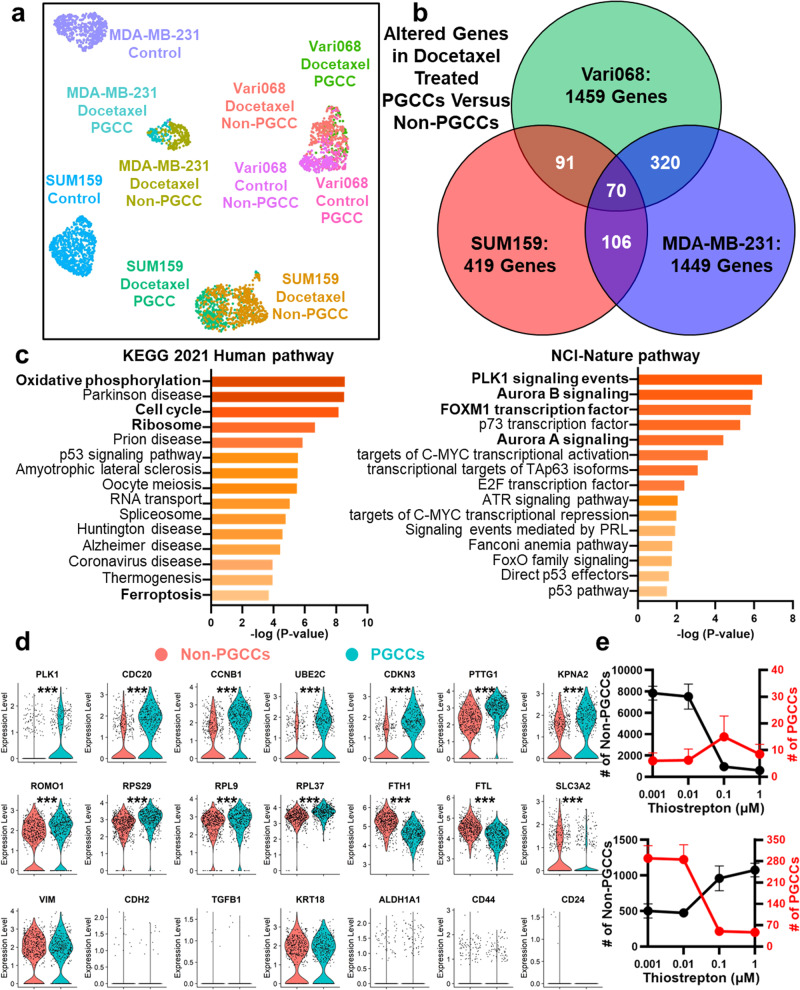
Fig. 5. Single-cell transcriptome analysis of breast cancer PGCCs and non-PGCCs.
a UMAP plot of single-cell transcriptome analysis, including PGCCs and non-PGCCs with and without Docetaxel treatment of three breast cancer cell lines (SUM159, MDA-MB-231, and Vari068). The x-axis represents UMAP1, the y-axis represents UMAP2, and each dot represents one cell. Different colors represent different cell populations/treatment conditions. Number of cells in each population were provided in the “Methods” section. b Comparison between altered genes in docetaxel-treated PGCCs vs. non-PGCCs of three breast cancer cell lines. c Top-ranked pathways (the KEGG 2021 Human and the NCI-Nature pathway databases) were determined by the altered genes of SUM159 PGCCs versus non-PGCCs. The x-axis and color represent the P-values, and the y-axis indicates the names of pathways. d Violin plots of docetaxel-treated SUM159 PGCCs and non-PGCCs cells with statistical tests. The y-axis represents gene expression with a logarithmic scale. Each dot represents one cell. * refers to P < 0.05. ** refers to P < 0.01, and *** refers to P < 0.001. e Treatment of Thiostrepton (FOXM1 inhibitor) at 4 concentrations (1 μM, 0.1 μM, 0,01 μM, and 0.001 μM) on SUM159 cells. The upper figure shows the treatment of cells without Docetaxel pre-treatment, and the lower figure shows the treatment of cells after Docetaxel pre-treatment. The x-axis represents the concentration of Thiostrepton. The left y-axis (black) represents the number of non-PGCCs, and the right y-axis (red) represents the number of PGCCs. The black curve indicates the number of non-PGCCs, and the red curve indicates the number of PGCCs. Error bars indicate the standard error of the mean (SEM), n = 4.

