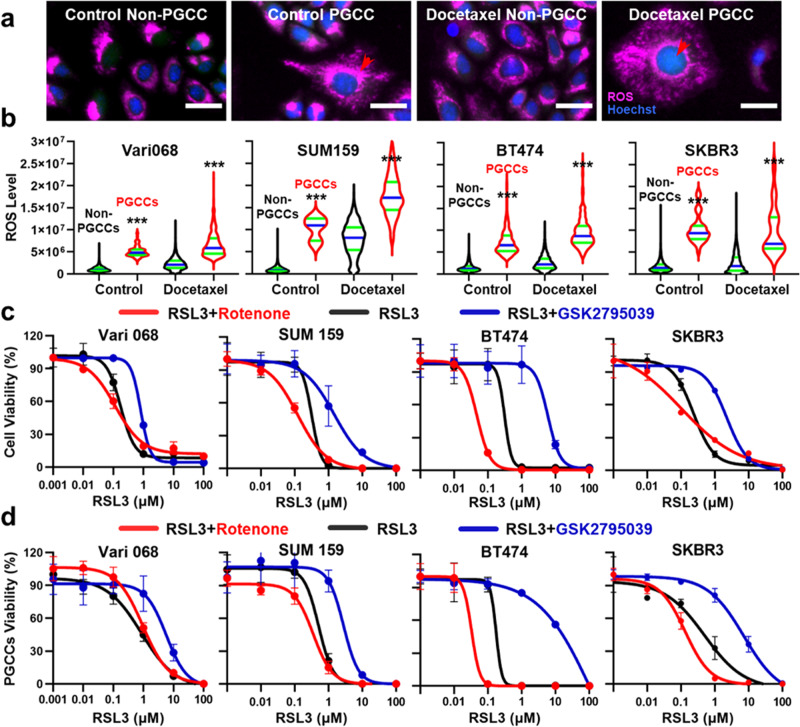
Fig. 6. The elevated ROS level of PGCCs is essential to ferroptosis sensitivity.
a Representative images of Vari068 PGCCs and non-PGCCs treated with DMSO control and 1 μM Docetaxel. Cells were stained with Live (green), Dead (red), Hoechst (blue), and CellROX™ Deep Red (Purple) staining. PGCCs are marked with red arrows. (Scale bar: 100 μm). b The ROS level of PGCC groups is significantly higher than non-PGCCs groups both for DMSO control and 1 μM Docetaxel treatment for Vari068 (Control: n = 16,082 non-PGCCs and 89 PGCCs, Docetaxel: n = 8455 non-PGCCs and 401 PGCCs), SUM159 (Control: n = 31,705 non-PGCCs and 6 PGCCs, Docetaxel: n = 1588 non-PGCCs and 133 PGCCs), BT474 (Control: n = 9181 non-PGCCs and 585 PGCCs, Docetaxel: n = 3885 non-PGCCs and 346 PGCCs) and SKBR3 (Control: n = 11,071 non-PGCCs and 39 PGCCs, Docetaxel: n = 3771 non-PGCCs and 18 PGCCs). The black violin plot indicates non-PGCCs, and the red violin plot indicates PGCCs. The green lines represent quartiles and the blue lines the median of all cells. c Rescue and sensitize cells to ferroptosis by altering the ROS level. Rotenone was selected to boost and GSK2795039 to reduce the ROS level. Compound efficacy IC50 curves of RSL3 (from 100 μM to 0.001 μM) alone (black), RSL3 with Rotenone (red), and RSL3 with GSK2795039 (blue) were tested for comparison. IC50s are provided in Supplementary Table 27. Error bars indicate the standard error of the mean (SEM), n = 3. d Rescue and sensitize induced PGCCs to ferroptosis by altering the ROS level. Docetaxel (1 μM) was treated to induce PGCCs for Vari068 and SUM159, and Alisertib (1 μM) was treated to induce PGCCs for BT474 and SKBR3 cell lines. Compound efficacy IC50 curves of RSL3 (from 100 μM to 0.001 μM) alone (black), RSL3 with Rotenone (red), and RSL3 with GSK2795039 (blue) were tested for comparison. IC50s are provided in Supplementary Tables 28 and 29. Error bars indicate the standard error of the mean (SEM), n = 3.

