FIG. 2.
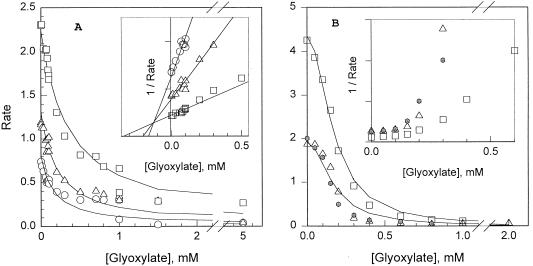
Inhibition of AHAS activity of glyoxylate. (A) Effect of glyoxylate on AHAS I. The activity in the presence of various glyoxylate concentrations was monitored by a standard method at pyruvate concentrations of 0.5 mM (○), 1 mM (▵), or 3 mM (□). The data could be fit (curves) by assuming competitive inhibition, with a Km (pyruvate) of 1.6 mM and a Ki (glyoxylate) of 0.14 mM. The insert is a Dixon plot of the data. (B) Effect of glyoxylate on AHAS II. In addition to experiments at 1 mM (▵) or 3 mM (□) pyruvate, measurements were made in the presence of 1 mM pyruvate plus 0.1 mM 2-ketobutyrate ( ), conditions under which >85% of the product was expected to be acetohydroxybutyrate (24). The data could not be fit by any simple inhibition mechanism; the curves are a fit of the data (pyruvate only) to competition dependent on the square of the glyoxylate concentration: V(inhibited) = V0/{1 + ([glyoxylate]/K)2}, where K is 0.169 mM. The insert is a Dixon plot of the data.

