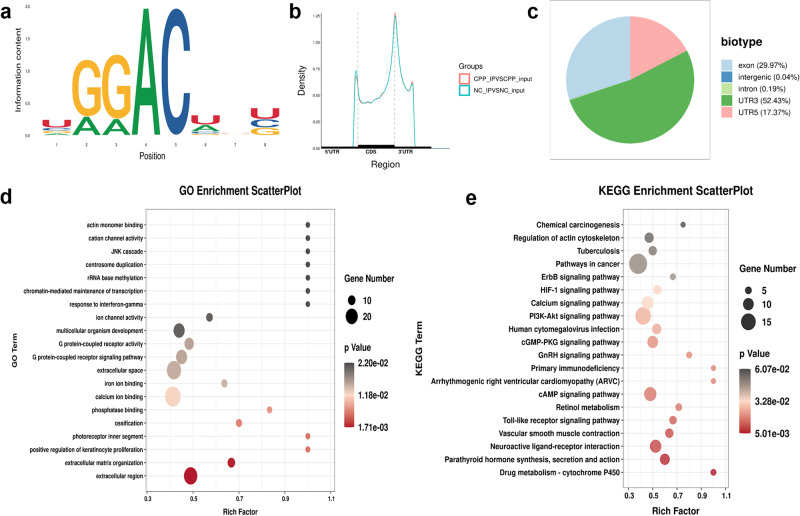
Fig. 3. Hypothalamic m6A epitranscriptome sequencing in CPP rats at 3 weeks.
a Most abundant motifs detected in peaks and enriched at peak summits. b Distribution of m6A peaks throughout the whole mRNA transcript. c Proportion of m6A peak distribution in exons, intergenic regions, introns, 3′UTRs or 5′UTRs across the entire set of mRNA transcripts. d ClusterProfiler identified the enriched GO processes of 613 genes, which showed 1.5-fold m6A expression in CPP rat hypothalami compared with NC rat hypothalami. GO analysis of genes with hypomethylated peaks in CPP rats. e KEGG pathway analysis of differentially methylated genes in different groups. (NC, CPP; n = 3).

