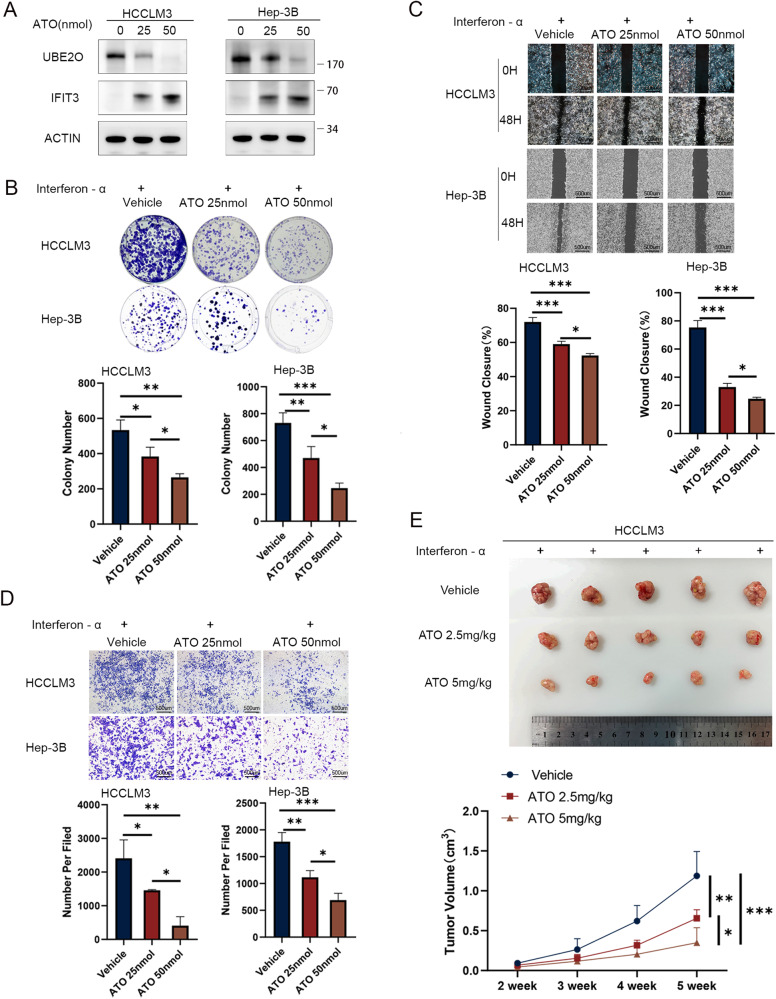
Fig. 7. ATO improves the effect of interferon-α therapy by inhibiting UBE2O in HCC.
Following treatment with interferon-α, cells were exposed to vehicle (0), 25 nmol of ATO, and 50 nmol of ATO for a duration of 4–8 h. Protein levels of UBE2O and IFIT3 were assessed via Western blot analysis (A). Cellular responses were evaluated using colony formation assays (B) wound healing assays (C) and migration assays (D). The images are from one representative experiment. The data are expressed as the mean ± SD of three independent experiments. *p < 0.05, **p < 0.01, ***p < 0.001. Ordinary one-way ANOVA with multiple comparisons testing was used to examine the statistical significance of differences among the three independent groups. (E) Three million HCCLM3 cells were implanted subcutaneously into nude mice. After 2 weeks, mice in the experimental and control groups were treated with interferon-α (5 × 10⁶ U/kg per day) combined with different concentrations of ATO (2.5 mg/kg or 5 mg/kg, daily), and tumor volumes were calculated periodically. Ordinary one-way ANOVA with multiple comparisons testing was used for statistical analysis. *p < 0.05, **p < 0.01, ***p < 0.001.

