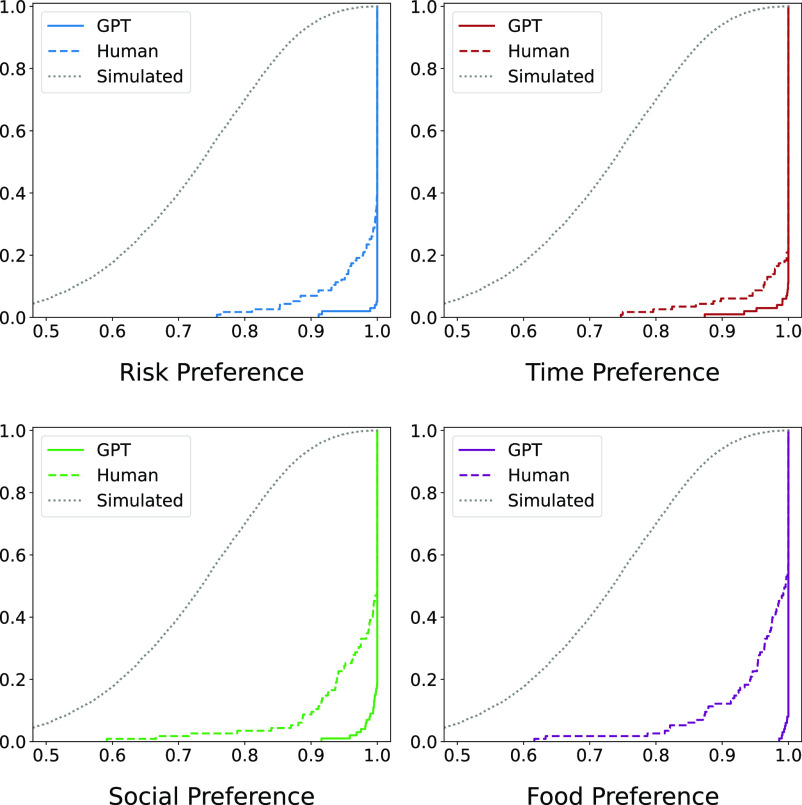
Fig. 1.
Cumulative distributions of the CCEI values. This figure consists of four subplots for four preference domains. Each subplot depicts a cumulative distribution function (CDF) plot, which shows the proportion of CCEI values less than or equal to a specific threshold. The light dotted lines represent simulated subjects, the dark dashed lines represent human subjects, and the solid lines represent GPT observations.

