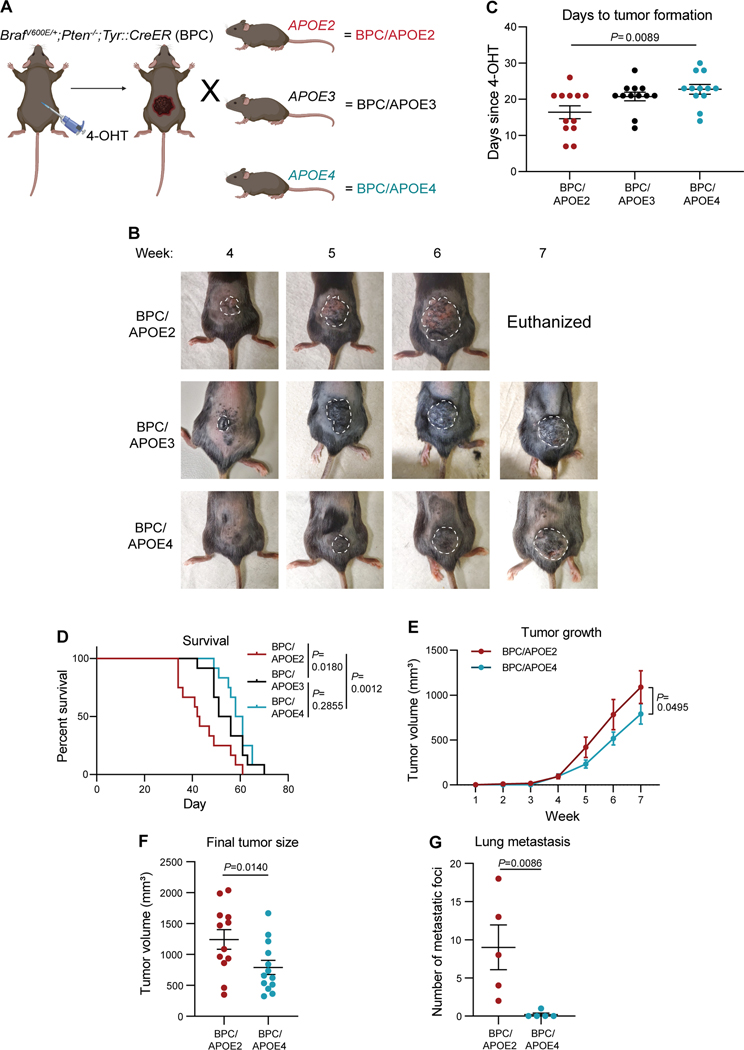
Figure 1. Common human APOE variants differentially impact melanoma growth and metastasis in a genetically engineered mouse model.
A, Schematic depicting generation of, and tumor induction in, the Braf V600E/+;Pten−/−;Tyr::CreER;APOE2 (BPC/APOE2), ;APOE3 (BPC/APOE3), and; APOE4 (BPC/APOE4) mouse models. Created with BioRender.com. B, Representative images of tumor growth in BPC/APOE2, BPC/APOE3, and BPC/APOE4 mice 4 to 7 weeks after topical administration of 4-OHT. C, Number of days after topical 4-OHT administration until tumors were palpated and visualized in BPC/APOE2, BPC/APOE3, and BPC/APOE4 mice (n=12 per group). One-way ANOVA. D, Kaplan-Meier survival curves of BPC/APOE2, BPC/APOE3, and BPC/APOE4 mice after topical 4-OHT administration (n=12 per group). Log-rank test. E, Tumor growth curve of BPC/APOE2 (n=12) and BPC/APOE4 (n=13) mice after topical 4-OHT administration. Two-way ANOVA. F, Final tumor volumes of BPC/APOE2 (n=12) and BPC/APOE4 (n=13) mice from E at the experimental endpoint of 49 days after topical 4-OHT administration. Unpaired t-test. G, Quantification of lung metastatic foci in BPC/APOE2 (n=5) and BPC/APOE4 (n=5) mice after neonatal tumor induction. Unpaired t-test.

