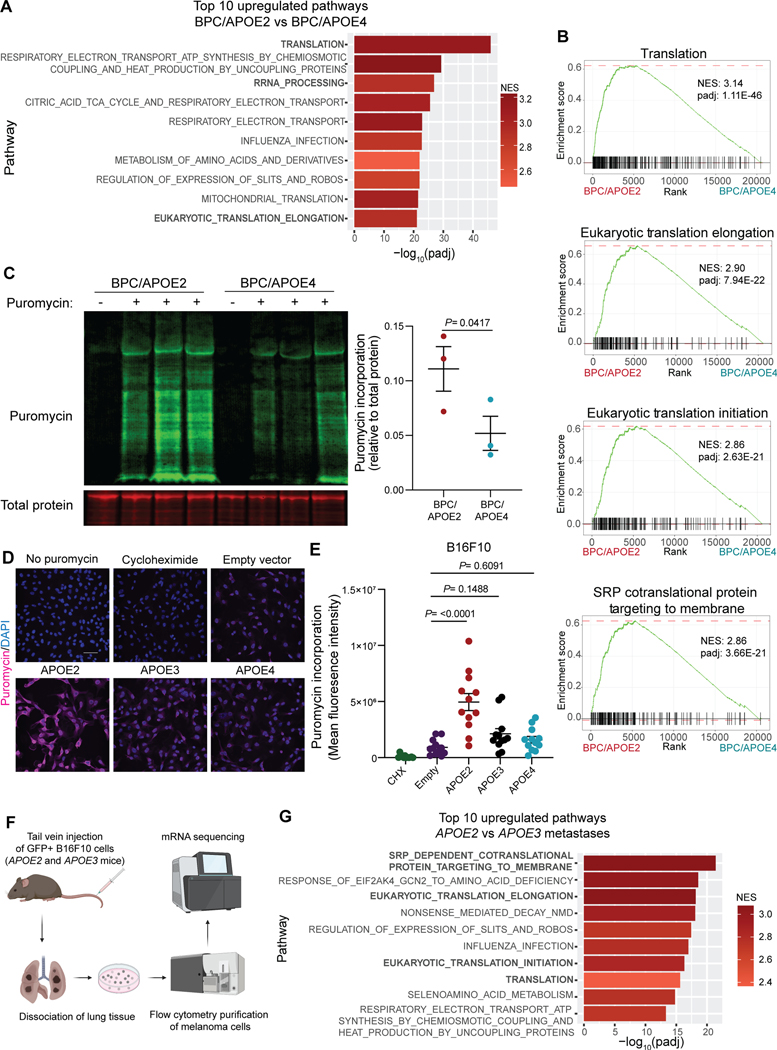
Figure 2. Common APOE germline genetic variants modulate protein synthesis in melanoma.
A, Top ten pathways upregulated in melanomas of BPC/APOE2 mice relative to BPC/APOE4 mice as determined by GSEA and ranked by adjusted p-value (n=4 per group; NES, normalized enrichment score; padj, adjusted p-value). B, Enrichment plots of translation-related pathways within the Reactome gene set. C, Western blot of puromycin incorporation into BPC/APOE2 and BPC/APOE4 tumors 35 days after 4-OHT administration (n=3 per group). Non-puromycin-pulsed mice were included as an antibody control. Unpaired t-test. D, Representative immunofluorescence images of puromycin incorporation into B16F10-shApoe pBabe Empty, APOE2, APOE3, and APOE4 cells. Non-puromycin-pulsed and cycloheximide (CHX)-treated cells were included as negative and positive controls, respectively (scale bar = 50μM). E, Quantification of mean fluorescence intensity from SUnSET assay in D. One-way ANOVA (n=3 independent experiments). F, Schematic depicting the workflow utilized to analyze transcriptomes of B16F10 lung metastases derived from APOE2 and APOE3 knock-in mice. Created with BioRender.com. G, Top ten pathways upregulated in APOE2 (n=8) lung metastases relative to APOE3 (n=5) as determined by GSEA and ranked by adjusted p-value (NES, normalized enrichment score; padj, adjusted p-value)

