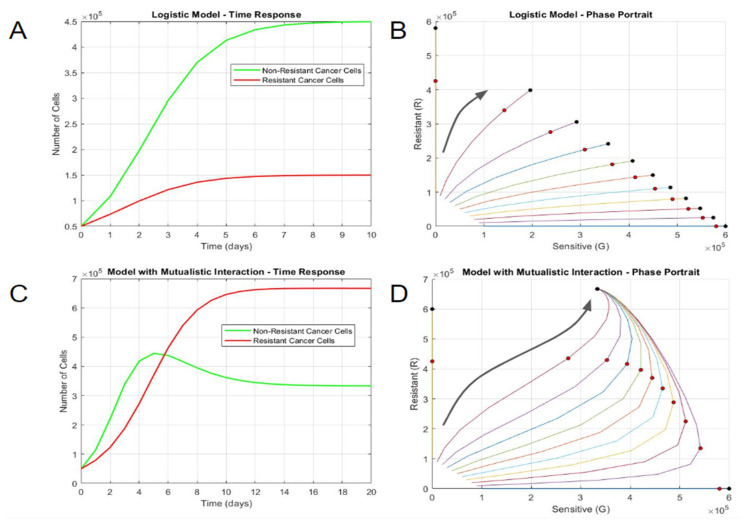
Figure 1.
Long-term growth behaviors differentiate non-interacting and interacting cell populations. (A) Time response and (B) phase portrait of logistic model without interaction. (C) Time response and (D) phase portrait of logistic model with mutualistic interaction. In the phase portraits, the horizontal axis represents the number of sensitive DLBCL cells, and the vertical axis represents the number of resistant DLBCL cells. Each curve in the phase portrait was created by altering the percentage of sensitive and resistant cells while keeping a constant initial population. The larger black arrows represent the general trajectories of population growth. The red circles represent the states on day 5, while the black circle represents the steady state(s) at much longer time periods (day 100).

