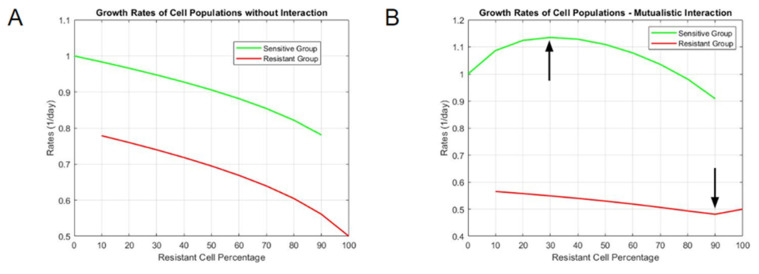
Figure 2.
Interpolated growth rate constants of mixed cultures (A) without interaction and (B) with mutualistic interaction. The vertical axis represents the magnitude of rate constants, and the horizontal axis represents the resistant cell percentage in each tested population proportion (a resistant cell percentage of 60 means that the rate constants for each clone are derived from a starting culture of 40% sensitive DLBCL cells and 60% resistant DLBCL cells).

