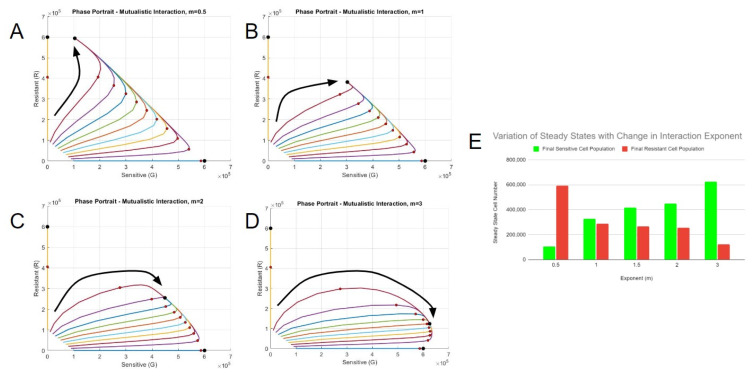
Figure 4.
Correlation yields multiple best-fit models. Phase portraits of systems with best-fit constants with the interaction exponents (A) m = 0.5, (B) m = 1, (C) m = 2, and (D) m = 3. The red circles represent the states on day 5, and the black circle represents the steady state(s). The larger black arrows represent the general trajectories of each scenario. (E) The final number of cells at steady state for each interaction exponent scenario.

