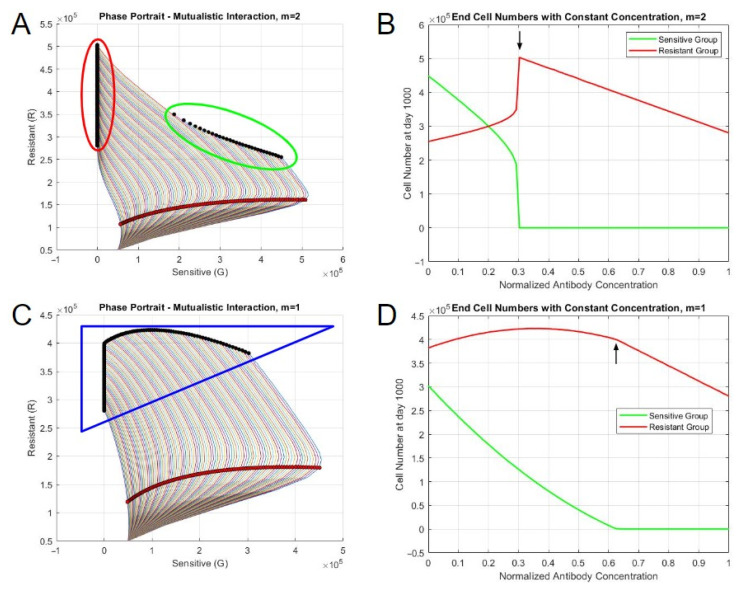
Figure 5.
Steady-state behaviors of systems with constant therapy. (A) Phase portrait when m = 2. (B) End cell numbers when m = 2. (C) Phase portrait when m = 1. (D) End cell numbers when m = 1. The red shaded circles represent the states on day 5, and the black shaded circles represent the steady states. The outlines encircling sets of steady states represent distinct behaviors based on the concentration of therapy.

