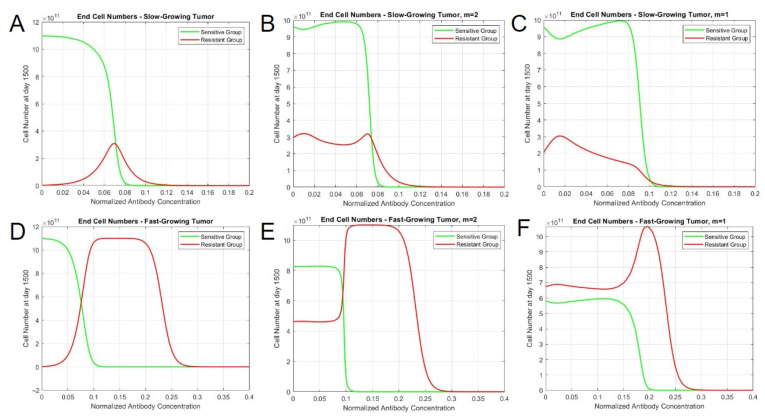
Figure 6.
Tumor composition varies based on interaction type, tumor growth, and therapy concentration. End cell numbers for (A) slow-growing tumor, without interaction; (B) slow-growing tumor, m = 2; (C) slow-growing tumor, m = 1; (D) fast-growing tumor, without interaction; (E) fast-growing tumor, m = 2; and (F) fast-growing tumor, m = 1. The vertical axis represents the cell number at day 1500, and the horizontal axis represents the magnitude of the antibody concentration with a constant treatment cycle.

