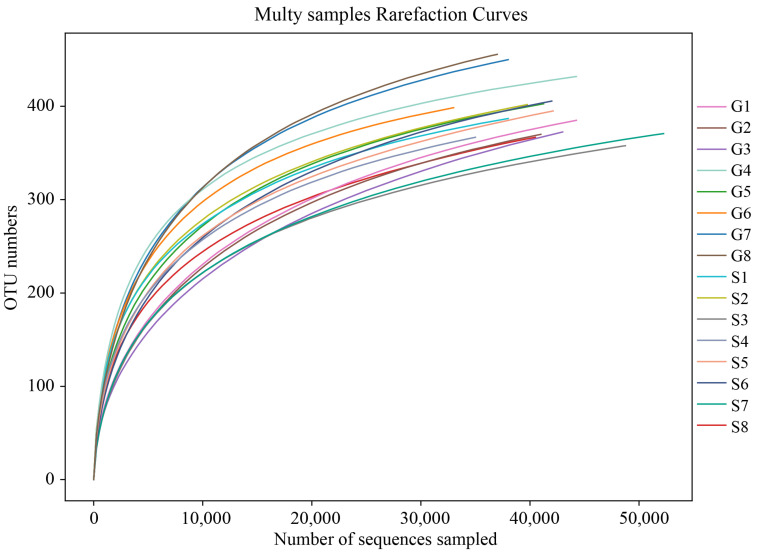
Figure 1.
Rarefaction curve. The x-coordinate is the number of sequences sampled, and the y-coordinate is the number of observed OTUs. Each curve in the graph represents a sample, which is labeled with a different color. The number of OTUs increases with the sequencing depth. When the curve becomes stable, the number of detected OTUs does not increase with the expansion of extracted data, indicating a time when the amount of sequencing data is reasonable.

