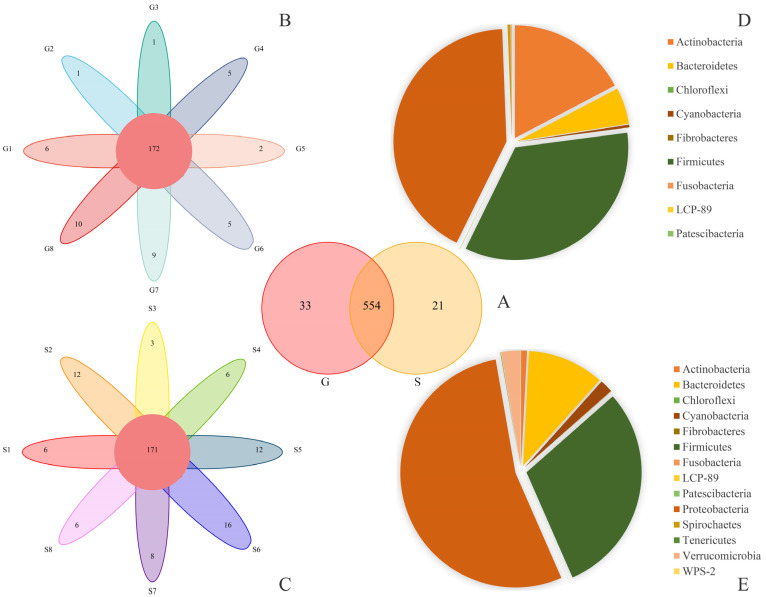
Figure 2.
OTU Venn diagram, flower diagram, and microflora structure (phylum level) pie chart. The Venn and flower diagrams show the overlapping number of multiple color graphs, which refers to the total number of OTUs shared by G and S individuals, and the non-overlapping number, which refers to the unique number of OTUs in each sample. The pie diagrams show different colored blocks for different types of microbiotas (phylum level), and the numbers on the colored blocks represent the percentage of the relative abundance of microbiota. (A) The number of OTUs shared by G and S. (B) The number of OTUs shared within G. (C) The number of OTUs shared within S. (D) The proportion of phylum relative abundance of S. (E) The proportion of phylum relative abundance of G.

