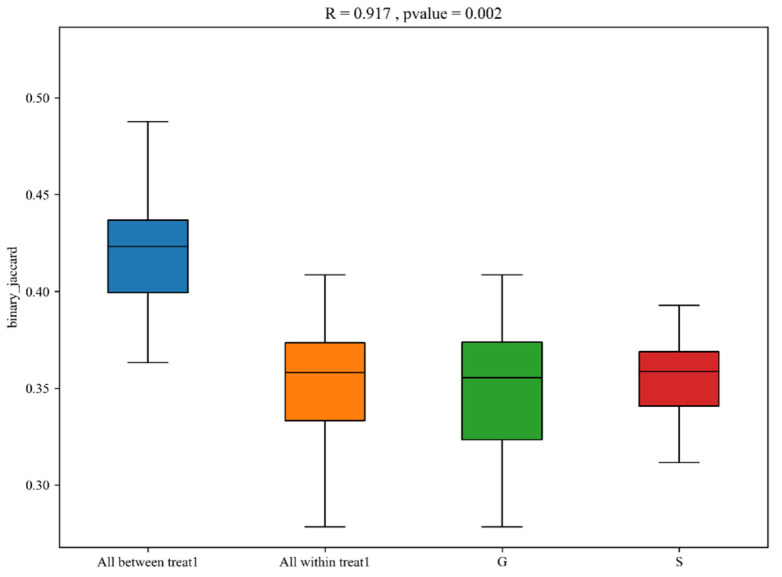
Figure 6.
Inter-group analysis of similarities (ANOSIM) boxplot of β-diversity. The y-axis represents the rank of the distance between samples, and the x-axis represents the results between both groups. Intra-group results are shown for each group. R value: R-value range (−1, 1). Actual results are generally between 0 and 1. An R-value close to 0 represents no significant inter-group and intra-group differences. An R-value close to 1 shows that inter-group differences are greater than intra-group differences. p-value: The p-value represents the confidence level of the statistical analysis; p < 0.05 reflects a statistically significant difference. In the plot, the R-value was close to 1, indicating that inter-group differences were greater than the intra-group differences, and p < 0.05 shows that this result was statistically significant.

