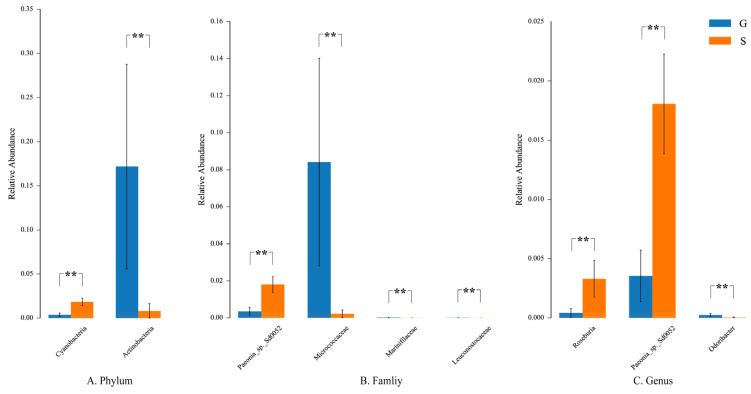
Figure 7.
ANOVA of inter-group samples. The plot from ANOVA shows differences in relative abundance (mean% ± SD) of two bacterial phyla, four bacterial families, and three bacterial genera. ** p < 0.01. (A) Relative abundance at the phylum level. (B) Relative abundance at the family level. (C) Relative abundance at the genus level.

