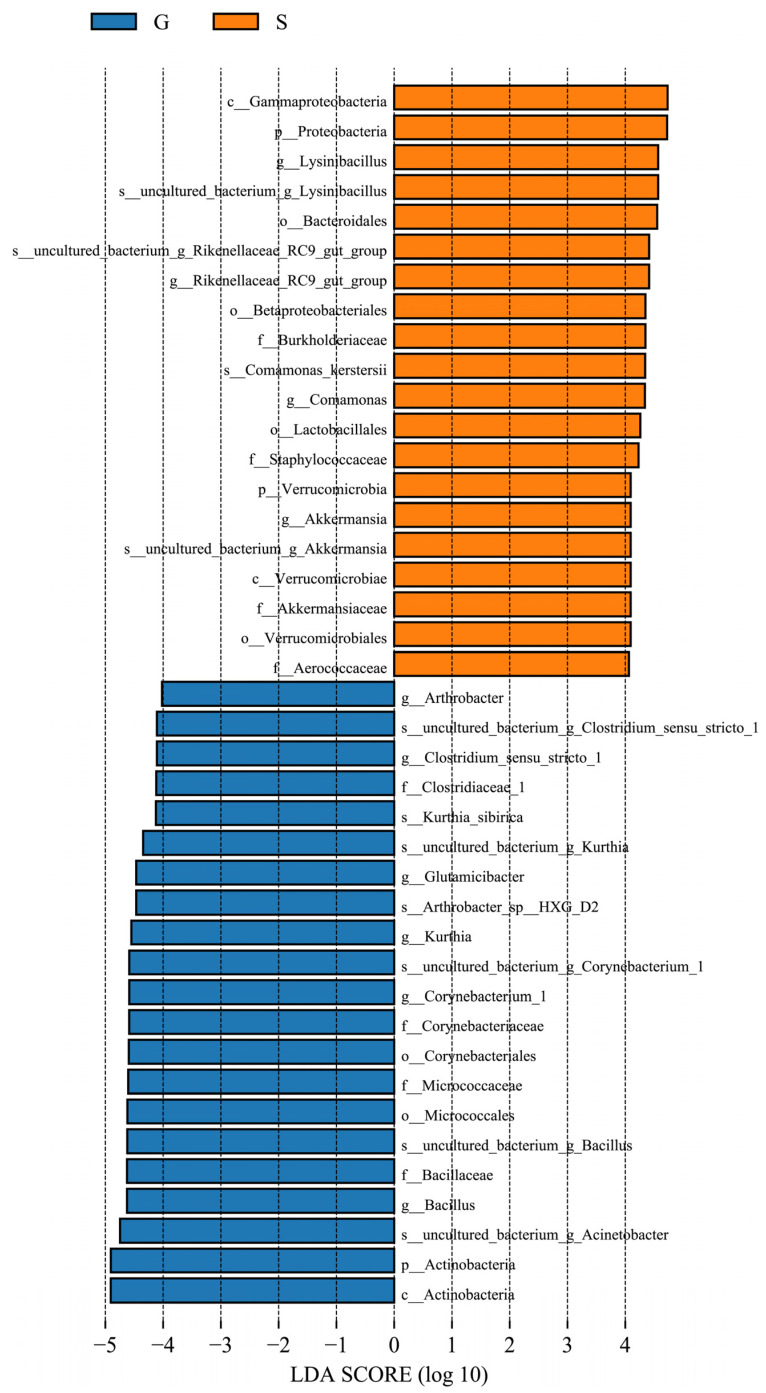
Figure 8.
Linear discriminant analysis (LDA) effect size (LEfSe) of inter-group samples. The length of the bar column represents the LDA score, and different colors represent different groups of species. The plot from LEfSe analysis shows the microbial taxa with significant differences between G (blue) and S (orange) (LDA score > 4).

